Will the decline of the dollar continue? Here's a comprehensive analysis of movement options of #USDX vs EUR/USD vs GBP/USD vs USD/JPY (DAILY) on March 10, 2020
Minor operational scale (daily time frame)
____________________
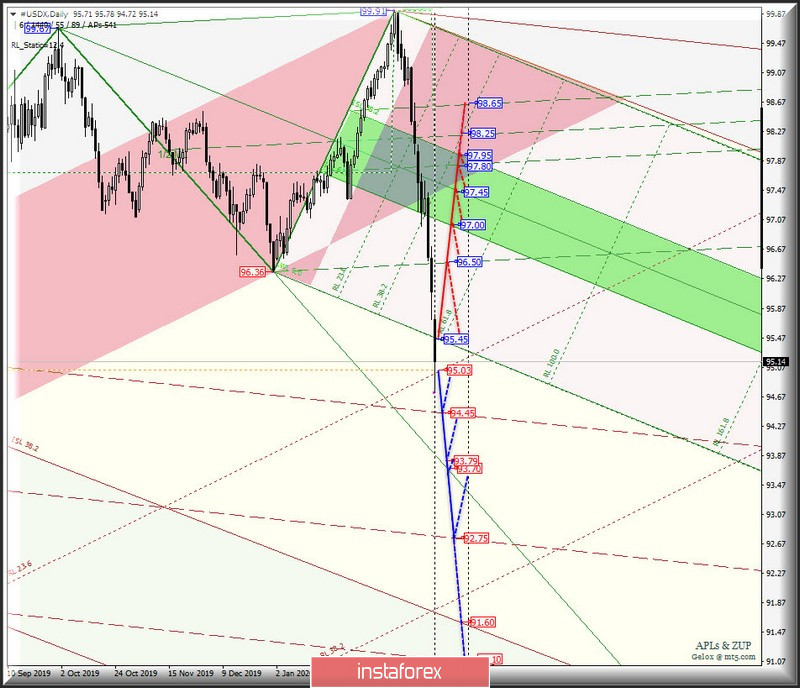
US dollar Index
The movement of the dollar index #USDXfrom March 10, 2020 will continue depending on the development and direction of the breakdown range:
- resistance level of 95.45 - final line FSL of the Minuette operational scale forks;
- support level of 95.03 - minimum of January 10, 2019
If the FSL terminal line (resistance level of 95.45) of the Minuette operational scale forks is broken down, it will become possible to develop an upward movement of the dollar index to the final Schiff Line (96.50) and the equilibrium zone (97.00 - 97.45 - 97.95) of the Minuette operational scale forks.
In the event of a breakdown of the minimum update of January 10, 2019 - support level of 95.03 - the downward movement of #USDX can be continued to the goals:
- the upper boundary of the channel 1/2 Median Line ( 94.45 ) of the Minor operational scale forks;
- control line LTL (93.79) of the Minuette operational scale forks;
- 1/2 Median Line Minor (92.75).
The markup of the #USDX movement options on March 10, 2020 is shown on the animated chart.
____________________
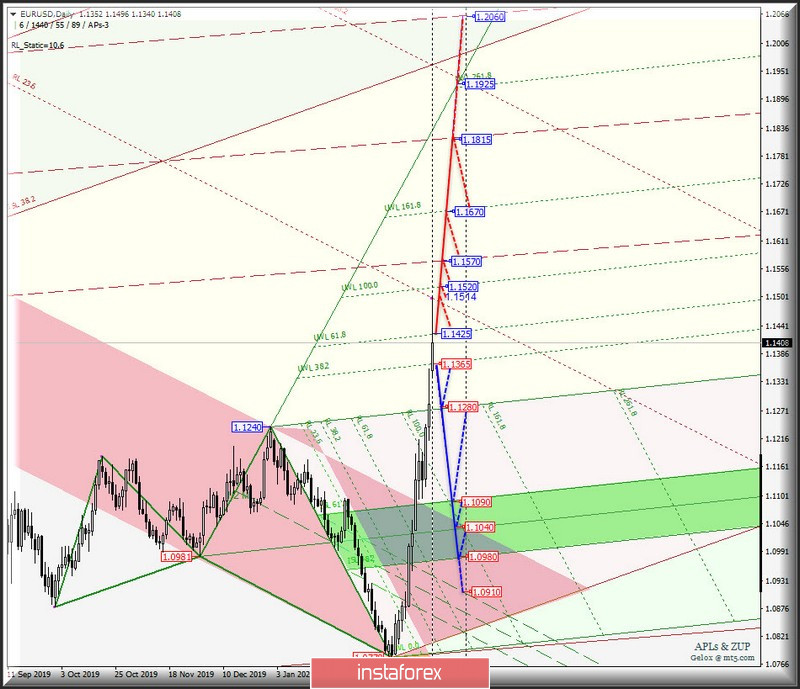
Euro vs US dollar
The single European currency EUR/USD was not able to break the maximum 1.1514 of January 31, 2019:
- resistance level of 1.1425 - warning line UWL61.8 of the Minuette operational scale forks;
- support level of 1.1365 - warning line UWL38.2 of the Minuette operational scale forks
The development and direction of the breakdown of which will determine the development of the movement of this instrument from March 10, 2020.
On the other hand, returning below the support level of 1.1365 on the warning line UWL38.2 Minute will determine the development of the downward movement of EUR / USD to the targets:
- the final line FSL Minuette (1.1280);
- equilibrium zones (1.1090 - 1.1040 - 1.0980) of the Minuette operational scale forks.
Alternatively, in case of a breakdown of the resistance level of 1.1425 on the warning line UWL61.8 of the Minuette operational scale forks, it will be relevant to resume the upward movement of the single European currency to the goals:
- maximum 1.1514 of January 31, 2019;
- warning line UWL100.0 Minuette (1.1520);
- the lower boundary of the 1/2 Median Line channel (1.1570) of the Minor operational scale forks;
- warning line UWL161.8 Minuette (1.1670);
- 1/2 Median Line Minor (1.1815).
The details of the EUR/USD movement options from March 10, 2020 are shown in the animated chart.
____________________
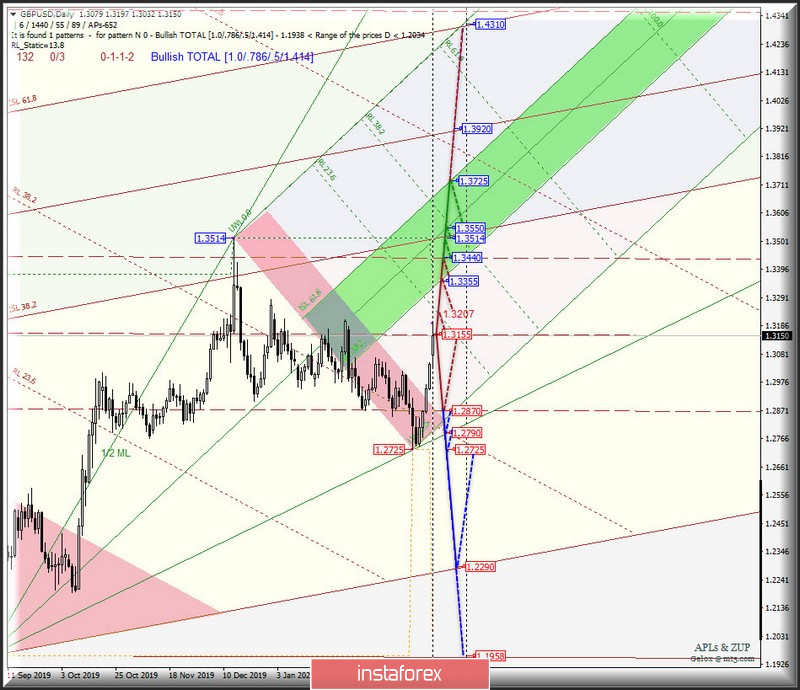
Great Britain pound vs US dollar
Her Majesty's currency was unable to update the maximum of 1.3207 of January 31, 2020 and continues to remain in the 1/2 Median Line (1.2870 - 1.3155 - 1.3440) of the Minor operational scale forks. The development of the GBP/USD movement will become determined by the development and breakdown direction of this channel - the movement details within the 1/2 Median Line Minor channel are presented on the animated chart.
The breakdown of the lower boundary (support level of 1.2870) of the 1/2 Median Line Minor channel will make it possible to continue the downward movement of Her Majesty's Currency towards the goals:
- control line LTL (1.2790) of the Minuette operational scale forks;
- local minimum 1.2725;
- SSL start line (1.2290) of the Minor operational scale forks.
On the contrary, the breakdown of the upper boundary (resistance level of 1.3440) of the 1/2 Median Line channel of the Minor operational scale forks will determine the further development of the GBP / USD movement in the equilibrium zone (1.3355 - 1.3550 - 1.3725) of the Minuette operational scale forks.
The details of the GBP/USD movement on March 10, 2020 is presented on the animated chart.
____________________
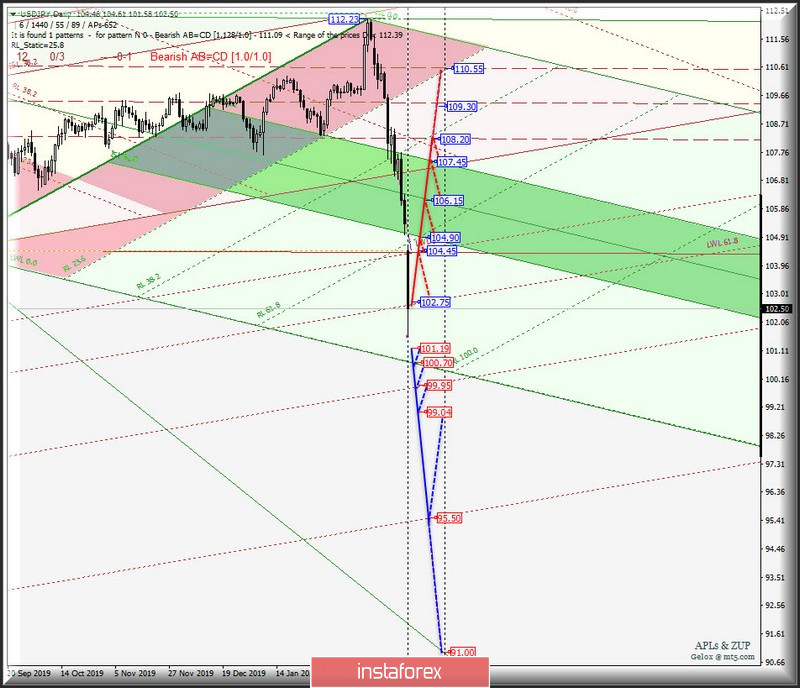
US dollar vs Japanese yen
The development of the currency movement of the "country of the rising sun" USD / JPY from March 10, 2020 will be determined by the development and the direction of the breakdown of the range:
- resistance level of 102.75 (warning line LWL61.8 of the Minor operational scale forks);
- support level 101.19 - minimum of November 09, 2016
The breakdown of the warning line LWL61.8 (resistance level of 102.75) of the Minor operational scale forks will direct the development of the currency of the country of the rising sun to the control line LTL (104.45) of the Minor operational scale forks and the equilibrium zone (104.90 - 106.15 - 107.45) of the Minuette operational scale forks.
In the event of a breakdown of the minimum update (support level of 101.19) of November 9, 2016, the downward movement of USD / JPY can be continued to the goals:
- the final line FSL Minuette (100.70);
- warning line LWL100.0 (99.95) of the Minor operational scale forks;
-minimum 99.04 on June 24, 2016;
- warning line LWL161.8 Minor (95.50).
The details of the USD/JPY movement on March 10, 2020 is presented on the animated chart.
____________________
The review was compiled without taking into account the news background. Thus, the opening trading sessions of major financial centers does not serve as a guide to action (placing orders "sell" or "buy").
The formula for calculating the dollar index :
USDX = 50.14348112 * USDEUR0.576 * USDJPY0.136 * USDGBP0.119 * USDCAD0.091 * USDSEK0.042 * USDCHF0.036.
where the power coefficients correspond to the weights of the currencies in the basket:
Euro - 57.6% ;
Yen - 13.6% ;
Pound Sterling - 11.9% ;
Canadian dollar - 9.1%;
Swedish krona - 4.2%;
Swiss franc - 3.6%.
The first coefficient in the formula leads the index to 100 at the start date of the countdown - March 1973, when the main currencies began to be freely quoted relative to each other.