This week we have an opportunity to observe an interesting pattern. The ability to use it is one of the key skills in technical analysis. This is a false breakout, which is a powerful signal for making a tradedeal in the opposite direction. However, not all traders understand how to distinguish a false breakout from a true one. Their descriptions available on the web do not provide clear understanding and only analyze graphic charts after the event has occurred. In this article, I will try to describe as clearly as possible the algorithm for detecting a false breakout so that you will be able to use it when analyzing the situation in the FOREX market. The EURUSD exchange rate will help us with this.
The concept of a time frame usually falls out of sight of many traders. Meanwhile it is a key factor that affects the definition and operation of technical patterns. The time frame determines not only how long a trade will be in the market, but also the development of chart patterns in the trading terminal.
A deal opened in the daily time frame will be in the market for one to three months. A deal opened in a 4-hour time frame will be in the market from one week to one month. A deal opened in an hourly time frame will be in the market from one day to one week. We are talking about 70% of cases, and deviations in one direction or another will occur within the normal distribution. Some of the deals will be closed outside the announced ranges, but their number will not exceed 30%
Understanding of the time a trade is in the market is very important not only for determining the amount of charged swaps, but also for the so-called "closing prices", which are the main element of technical analysis. Accordingly, for the daily time frame, the key closing prices will be the month and the quarter, for the four-hour frame time - the week and month, for the hourly time frame - the day and the week.
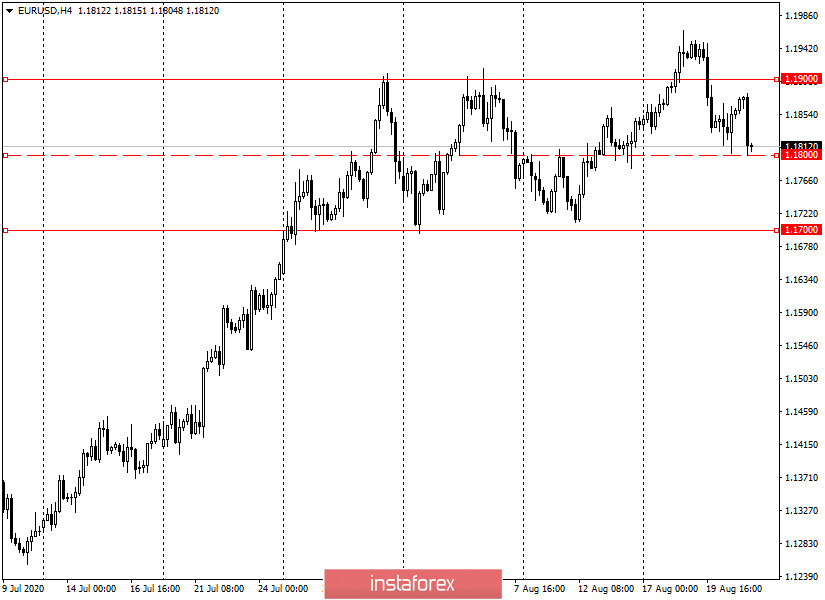
On InstaForex platforms, in the chart properties ("F8" key), traders need to set the "show period separators" parameter, after which the chart will automatically display horizontal lines showing the beginning and end of the period for each specific timeframe (Fig. 1). Thus, it will be easier to determine a false and true breakout. A breakout will be considered true when the closing price is above the key level and the price moves up, or below the key level when the price moves down and the main time period of the time frame is closed. Let's analyze the situation using a specific example of the current EUR/USD rate (Fig. 1).
Fig. 1
As seen from Chart 1, in the 4-hour time frame in July 2020, the European currency rate formed an upward trend, which formed a range in the area of 1.17–1.19 in late July and early August. In theory, any range is a trend continuation pattern, which in our case corresponds to an upward movement. However, some traders saw a "double top" on the EURUSD chart and rushed to take a short position, which was wrong, since the euro had not yet broken the bottom at 1.17. The mistake of traders who rushed to sell the euro was that they did not wait for the price to close below the base level at 1.17. Moreover, traders had to wait not only for the breakout at the bottom of the range from top to bottom, but also for the week to close below this level.
Reversing from the level of 1.17, the euro headed to the upper border of the range, made a breakout at the level of 1.19 from the bottom up. Traders, expecting the growth of the euro rate to the level of 1.24, began to open long positions, but that was not the case, and the price, having made a false breakout, returned back to the range. I am a little ahead of the events, calling the breakout "false", but with some confidence I assume that the EURUSD rate for the time remaining until the end of the trading week - several hours of the American session - will not be able to consolidate above the level of 1.19.
As we can see in both cases, traders made the same mistake - they opened a position before the end of the key period and lost money in both cases.
However, a false breakout is a significant trend reversal pattern. Therefore, after the current false breakout can we expect the EURUSD rate to reverse and decline? Yes, that's exactly what you can expect - you can't open a position. Anyone who is now in a hurry to open a position to sell the EURUSD risks losing money again.
No one knows where the price will go next, including me. We don't need it. We are required to outline targets at the top and bottom, and then wait for the price breakout in one direction or another. Using the methods of technical analysis, which are beyond the scope of this article, I can assume that the target of EURUSD at the top will be the level of 1.24, and the target of a possible decline will be the level of 1.12. Now I just have to wait in which direction a true breakout will occur. In other words, I am going to observe where at the end of the next week the price will be: above the level of 1.19 or below the level of 1.17. Then I am going to find a place to set a stop order and check the profit and risk ratios.
Possibly, while we are waiting for the close of the week, the price will change significantly and opening a position in one direction or another will no longer be profitable.
As you can see, applying a simple rule for the end (close) of the key period before making a decision can allow the trader to avoid unnecessary losses. Be careful and follow the money management rules.