EUR/USD
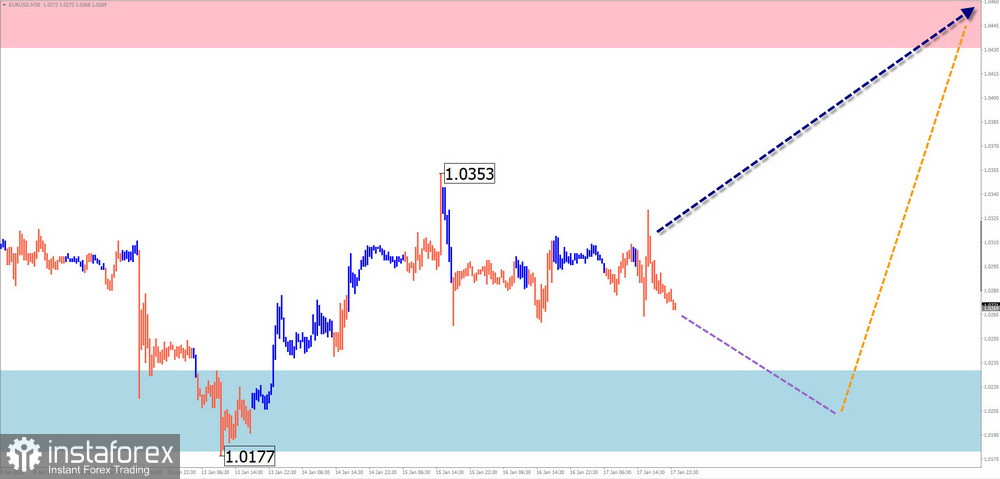
Analysis:Since August last year, the euro major pair has been developing a descending contracting flat pattern. The price decline brought quotes to the upper boundary of a strong weekly-scale potential reversal zone. Over the past three weeks, the price has moved sideways between opposing zones.
Forecast:This week, the euro is expected to continue its sideways movement. In the next couple of days, pressure on the support zone is likely, with a possible brief break below its lower boundary. Subsequently, the price is expected to return to the range between nearby zones, gradually rising toward the resistance level.
Potential Reversal Zones:
- Resistance: 1.0430–1.0480
- Support: 1.0230–1.0180
Recommendations:
- Sell: Small volume sales are possible within specific trading sessions.
- Buy: Lower volume purchases may be considered after reversal signals appear in the utilized trading system (TS).
USD/JPY
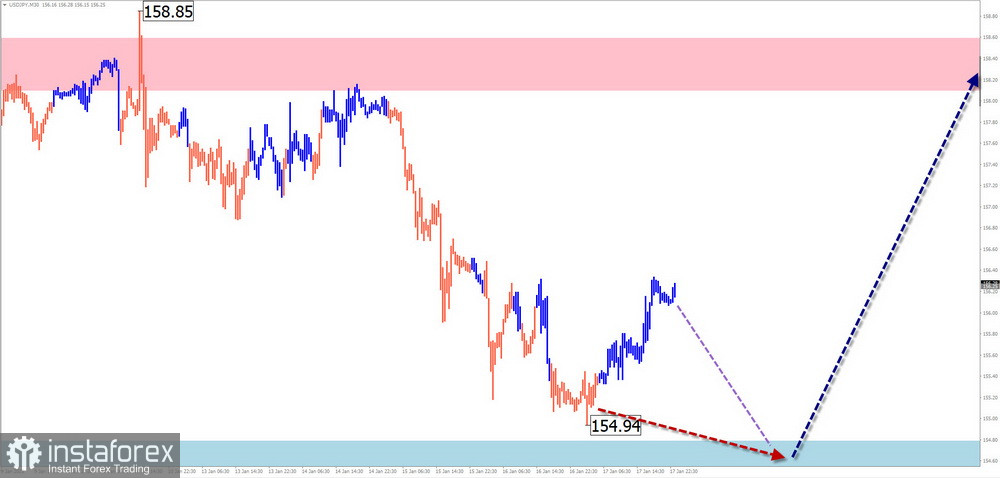
Analysis:Since last summer, the USD/JPY pair has been developing an upward zigzag wave. Since December, the price direction has reversed, forming a correctional phase. Currently, the wave structure remains incomplete. The bearish segment has reversal potential and could extend beyond a simple correction of the last trend wave.
Forecast:In the coming days, expect the price to move sideways, gradually declining toward the calculated support levels. By the week's end, a reversal and resumption of growth are expected, potentially bringing the price back to the resistance zone. A brief breach of the lower support boundary cannot be ruled out if the trend changes.
Potential Reversal Zones:
- Resistance: 158.10–158.60
- Support: 154.80–154.30
Recommendations:
- Sell: No suitable conditions for sales.
- Buy: Consider purchases after confirmed reversal signals within the support zone.
GBP/JPY
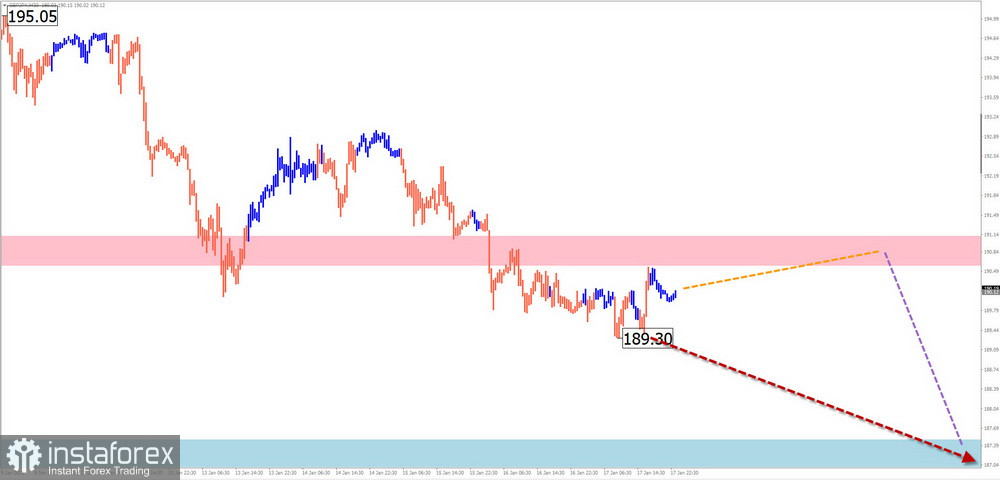
Analysis:Since December, a descending zigzag wave has been forming on the GBP/JPY pair chart. The wave structure remains incomplete, approaching a D1 timeframe level. Currently, the price has breached the boundaries of an intermediate support zone, which now acts as resistance. A correction is anticipated within the wave structure.
Forecast:This week, the upward segment is expected to complete. Near the calculated resistance zone, a reversal and resumption of the downtrend are likely. The highest activity is expected toward the end of the week.
Potential Reversal Zones:
- Resistance: 190.60–191.10
- Support: 187.50–187.00
Recommendations:
- Buy: Not advisable.
- Sell: Consider after reversal signals appear in the resistance zone.
USD/CAD
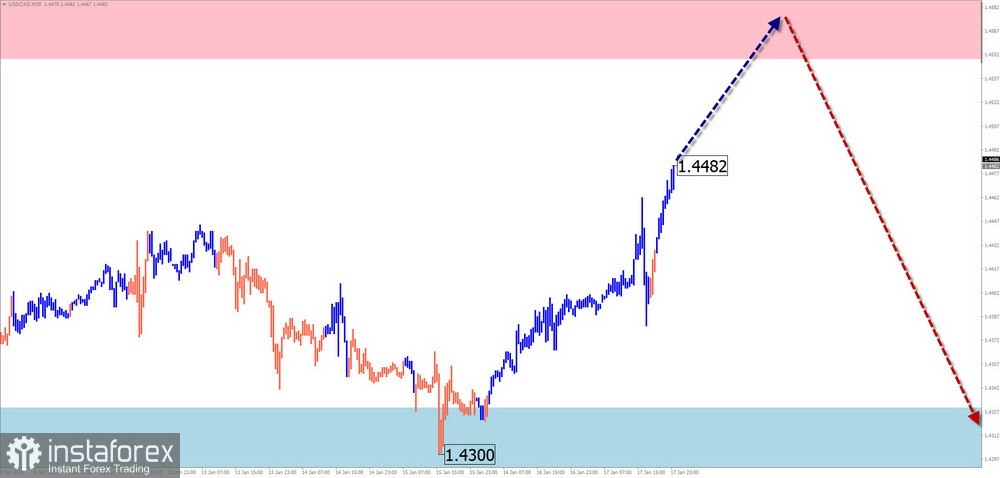
Analysis:Since late September, the USD/CAD pair has been forming an ascending wave. Over the past month, a counter-correction has emerged in the form of a stretched horizontal flat. This wave structure is incomplete as of now.
Forecast:Expect the uptrend to continue this week, potentially reaching the calculated resistance zone. A brief pullback toward the support boundary may occur early in the week, with increased volatility expected later in the week.
Potential Reversal Zones:
- Resistance: 1.4550–1.4600
- Support: 1.4330–1.4280
Recommendations:
- Sell: Low potential, likely unprofitable.
- Buy: Fractional volume purchases may be made following reversal signals in the support zone.
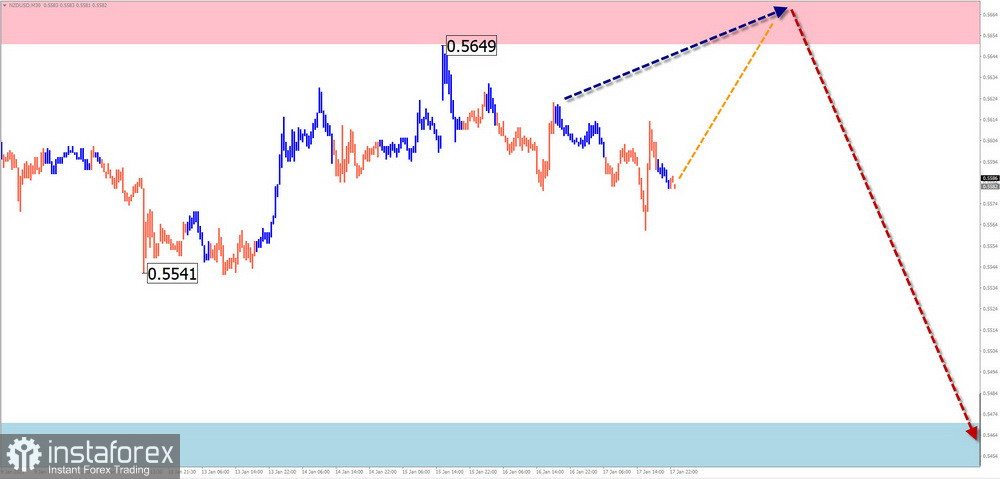
NZD/USD
Analysis:Since late September, the NZD/USD pair has seen a steady decline. From mid-December, a counter-correction in the form of a stretched flat has been forming. Prices are moving along an intermediate support/resistance zone. The correction structure remains incomplete.
Forecast:A steady decline from the calculated resistance zone to the support zone is likely in the coming week. Early in the week, brief pressure and a breach of the upper resistance boundary cannot be ruled out.
Potential Reversal Zones:
- Resistance: 0.5650–0.5700
- Support: 0.5470–0.5420
Recommendations:
- Buy: Not advisable.
- Sell: Sales may become the primary strategy after confirmation signals appear.
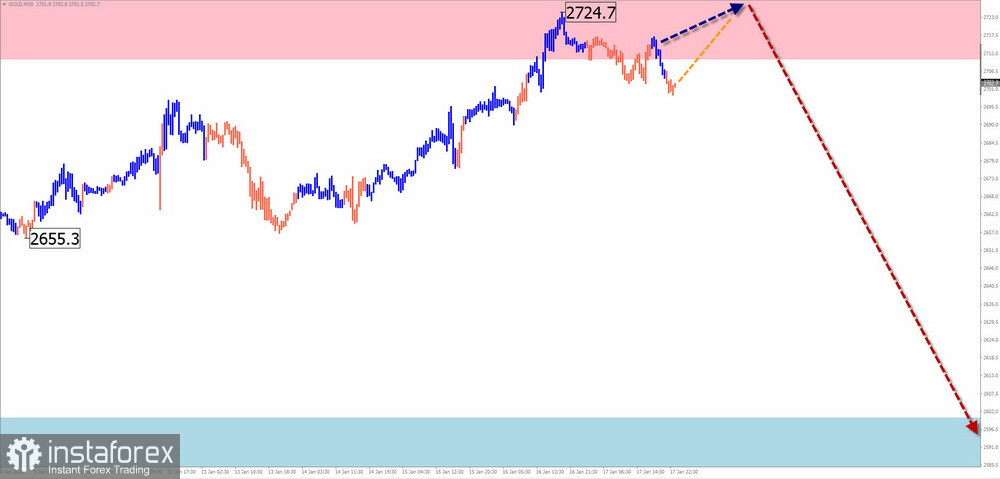
GOLD
Analysis:Since late October, gold prices have been forming a descending horizontal flat within a larger uptrend. Prices are moving within a flat range near a weekly-scale potential reversal zone.
Forecast:Gold is expected to maintain its overall sideways movement this week. After likely pressure on the resistance zone, a reversal and gradual decline toward the support zone are anticipated.
Potential Reversal Zones:
- Resistance: 2710.0–2730.0
- Support: 2600.0–2580.0
Recommendations:
- Sell: Fractional volume intraday sales may be considered.
- Buy: No suitable conditions for purchases.
Notes on Simplified Wave Analysis (SWA):
- All waves in SWA consist of three parts (A-B-C). The analysis focuses on the last, incomplete wave on each timeframe.
- Dotted lines indicate expected price movements.
- Caution: Wave algorithms do not account for the duration of movements over time!