signal strength 1 of 5
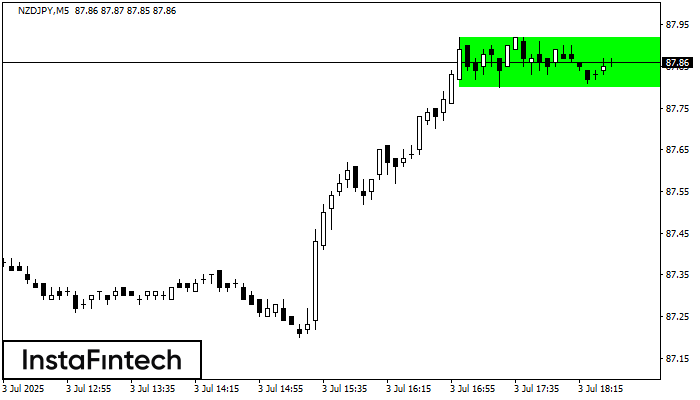
According to the chart of M5, NZDJPY formed the Bullish Rectangle. The pattern indicates a trend continuation. The upper border is 87.92, the lower border is 87.80. The signal means that a long position should be opened above the upper border 87.92 of the Bullish Rectangle.
The M5 and M15 time frames may have more false entry points.
See Also
- All
- Double Top
- Flag
- Head and Shoulders
- Pennant
- Rectangle
- Triangle
- Triple top
- All
- #AAPL
- #AMZN
- #Bitcoin
- #EBAY
- #FB
- #GOOG
- #INTC
- #KO
- #MA
- #MCD
- #MSFT
- #NTDOY
- #PEP
- #TSLA
- #TWTR
- AUDCAD
- AUDCHF
- AUDJPY
- AUDUSD
- EURCAD
- EURCHF
- EURGBP
- EURJPY
- EURNZD
- EURRUB
- EURUSD
- GBPAUD
- GBPCHF
- GBPJPY
- GBPUSD
- GOLD
- NZDCAD
- NZDCHF
- NZDJPY
- NZDUSD
- SILVER
- USDCAD
- USDCHF
- USDJPY
- USDRUB
- All
- M5
- M15
- M30
- H1
- D1
- All
- Buy
- Sale
- All
- 1
- 2
- 3
- 4
- 5
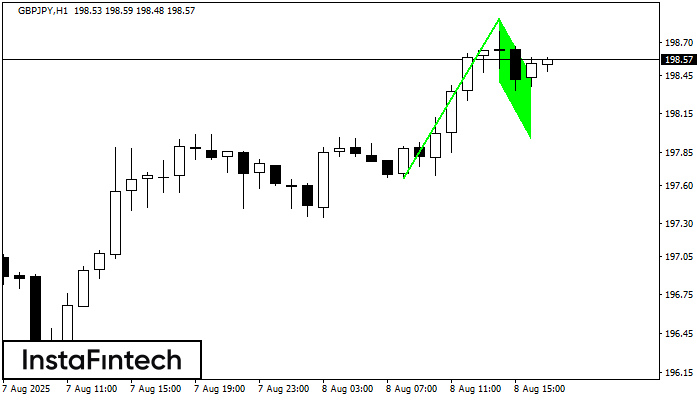
El patrón Bandera alcista ha sido formado en GBPJPY a H1. El límite inferior del patrón está ubicado en 198.39/197.95, mientras que el límite superior se encuentra en 198.89/198.45
Open chart in a new window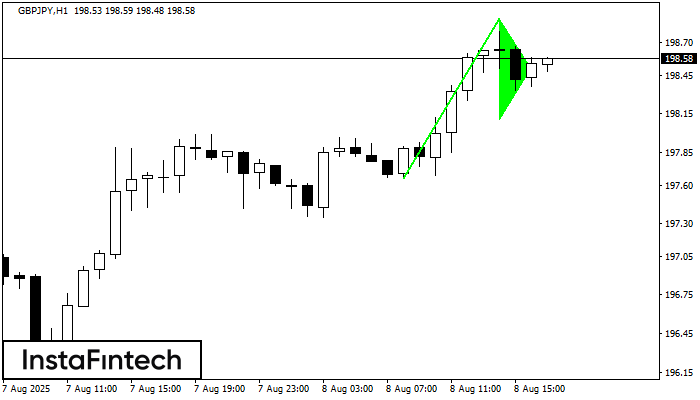
La señal Banderín alcista – Instrumento de negociación GBPJPY H1, patrón de continuación. Pronóstico: es posible establecer una posición de compra por encima del alza del patrón de 198.89
Open chart in a new window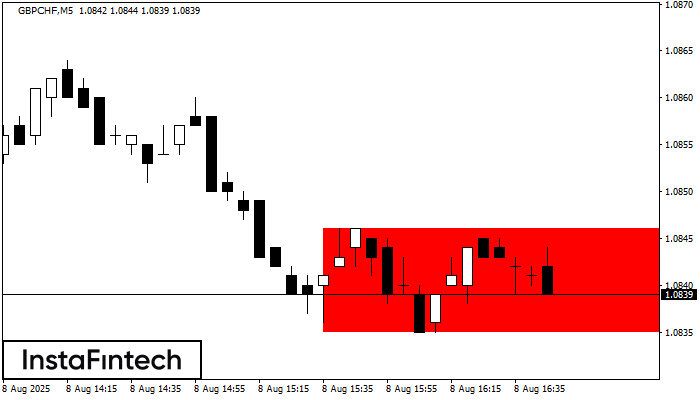
Según el gráfico de M5, GBPCHF formó el Rectángulo Bajista. El patrón indica la continuación de una tendencia. El límite superior es 1.0846, el límite inferior es 1.0835. La señal
Los marcos de tiempo M5 y M15 pueden tener más puntos de entrada falsos.
Open chart in a new window