signal strength 4 of 5
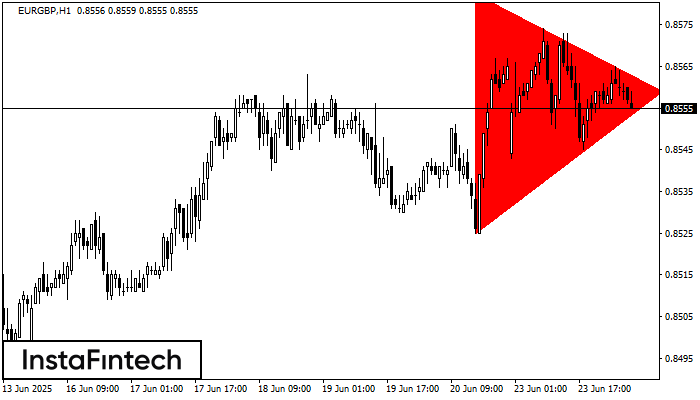
According to the chart of H1, EURGBP formed the Bearish Symmetrical Triangle pattern. Description: The lower border is 0.8525/0.8559 and upper border is 0.8583/0.8559. The pattern width is measured on the chart at -58 pips. The formation of the Bearish Symmetrical Triangle pattern evidently signals a continuation of the downward trend. In other words, if the scenario comes true and EURGBP breaches the lower border, the price could continue its move toward 0.8519.
See Also
- All
- Double Top
- Flag
- Head and Shoulders
- Pennant
- Rectangle
- Triangle
- Triple top
- All
- #AAPL
- #AMZN
- #Bitcoin
- #EBAY
- #FB
- #GOOG
- #INTC
- #KO
- #MA
- #MCD
- #MSFT
- #NTDOY
- #PEP
- #TSLA
- #TWTR
- AUDCAD
- AUDCHF
- AUDJPY
- AUDUSD
- EURCAD
- EURCHF
- EURGBP
- EURJPY
- EURNZD
- EURRUB
- EURUSD
- GBPAUD
- GBPCHF
- GBPJPY
- GBPUSD
- GOLD
- NZDCAD
- NZDCHF
- NZDJPY
- NZDUSD
- SILVER
- USDCAD
- USDCHF
- USDJPY
- USDRUB
- All
- M5
- M15
- M30
- H1
- D1
- All
- Buy
- Sale
- All
- 1
- 2
- 3
- 4
- 5
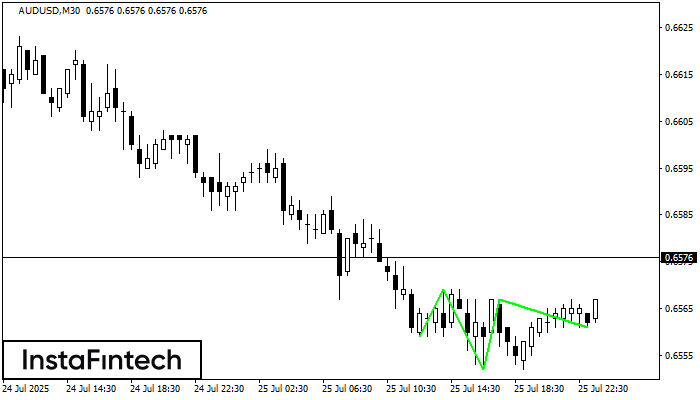
According to M30, AUDUSD is shaping the technical pattern – the Inverse Head and Shoulder. In case the Neckline 0.6569/0.6567 is broken out, the instrument is likely to move toward
Open chart in a new window
The Bearish pennant pattern has formed on the GBPAUD M15 chart. It signals potential continuation of the existing trend. Specifications: the pattern’s bottom has the coordinate of 2.0468; the projection
The M5 and M15 time frames may have more false entry points.
Open chart in a new window
The Double Bottom pattern has been formed on NZDUSD M15; the upper boundary is 0.6010; the lower boundary is 0.6000. The width of the pattern is 11 points. In case
The M5 and M15 time frames may have more false entry points.
Open chart in a new window