1. Market Sentiment Summary:
After Gold rose quite significantly yesterday, this morning Gold experienced a downward correction of up to -0.39% where the correction was a combination of the current geopolitical conditions and the dynamics of the money market that were occurring from the Technical side yesterday there was indeed a Divergence between the movement of Gold prices and it was also in an Overbought condition so it is natural that a correction occurred today.
2. Technical Analysis:
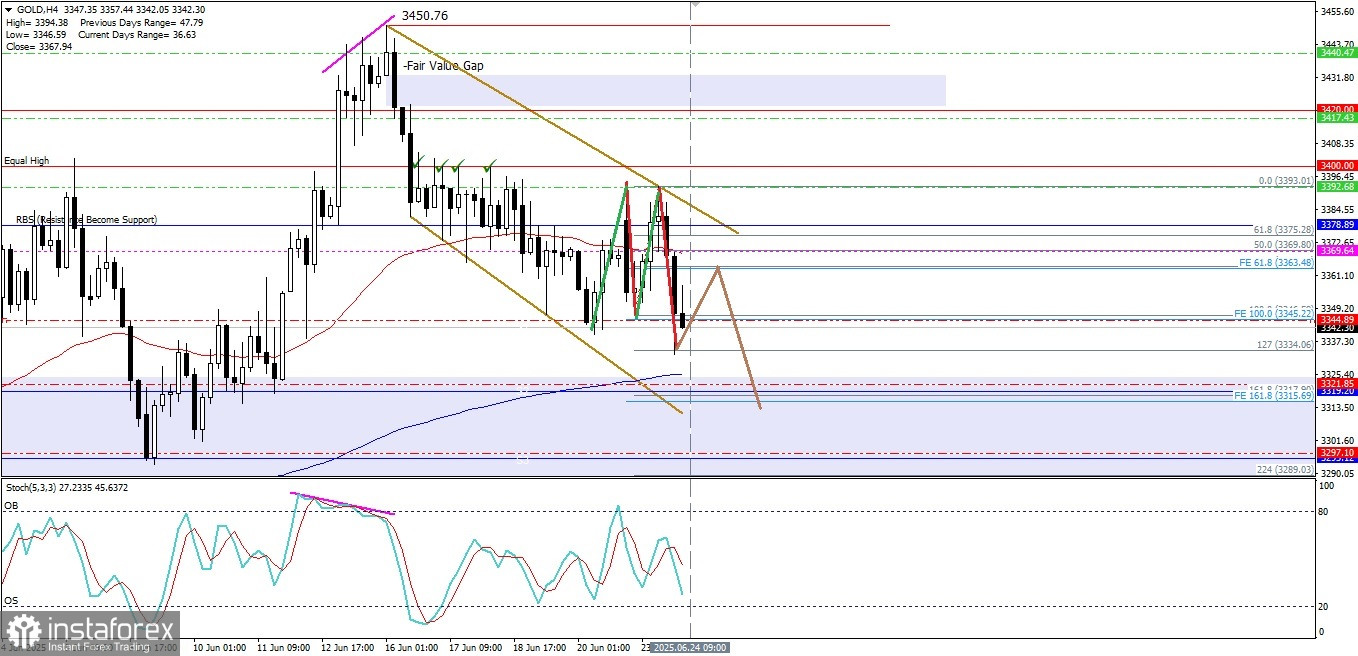
2.1. Liqudity at the Market:
BUY Stop Order is at the level : 3420.00
SELL Stop Order is at the level : 3360-3355 (sudah berhasil ditembus).
There is an Equal High on the level 3400 (Round Number) indicating Liquidity at that level.
3. Technical Indicator:
3.1. Pivot Point:
Resistance. 3 : 3440.47.
Resistance. 2 : 3417.43.
Resistance. 1 : 3392.68.
PIVOT : 3369.64.
Support. 1 : 3344.89.
Support. 2 : 3321.85.
Support. 3 : 3297.10
3.2. Moving Average:
EMA 50 : 3369.88
EMA 200 : 3325.29
Golden Cross : Bias Bullish (Timeframe H4) however there is a weakening correction
3.3. Stochastic Oscillator:
Stoch Signal : 46.13.
Signal : 57.10.
Stochastic Oscillator position is heading towards the Oversold level (20) with a Crossing SELL condition
3.4. Chart & Candlestick Pattern:
Currently on the 4-hour chart, there is a Candlestick with a body full of Black indicating a significant weakening momentum, the detected chart pattern is the Bullish Flag pattern.
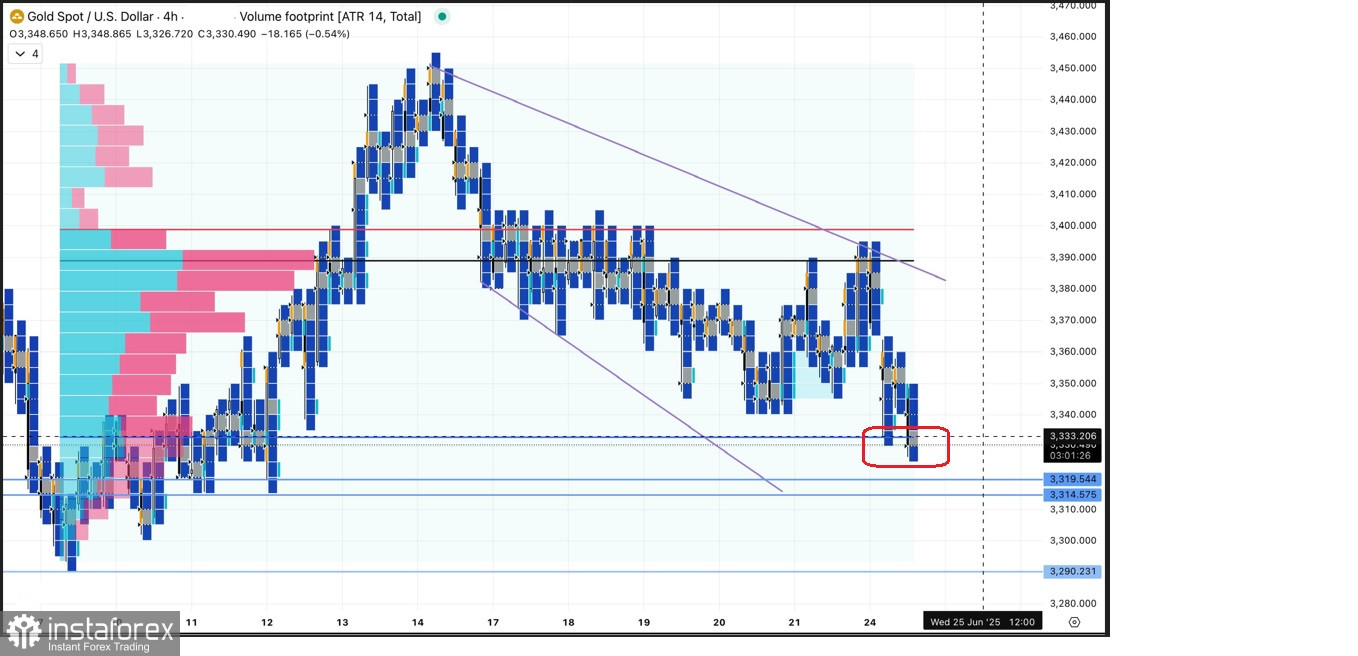
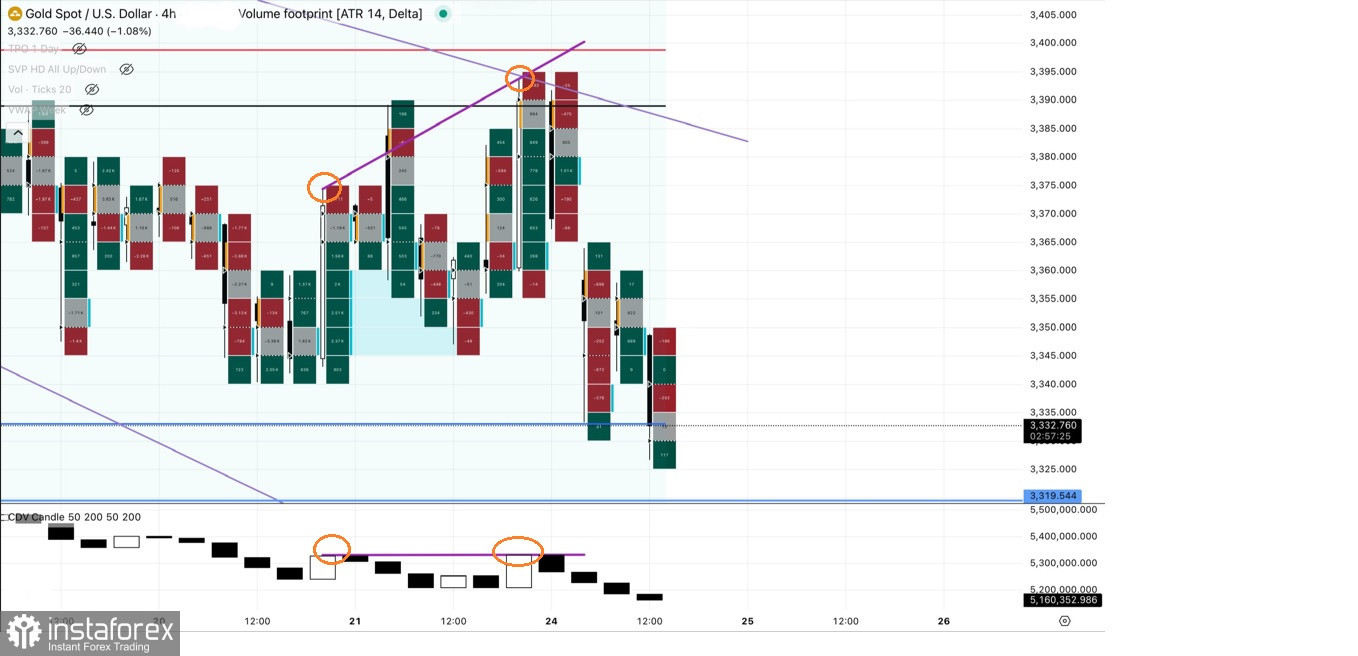
3.5 Footprint Chart.
3.5.1. Total Footprint Chart Total.
On the Footprint Chart base Total, it appears to have successfully breaks below the Value Area Low level of 3333.01 from the Fix Volume Profile from Low to the previous High and is now trying to reach the level of 3319.54
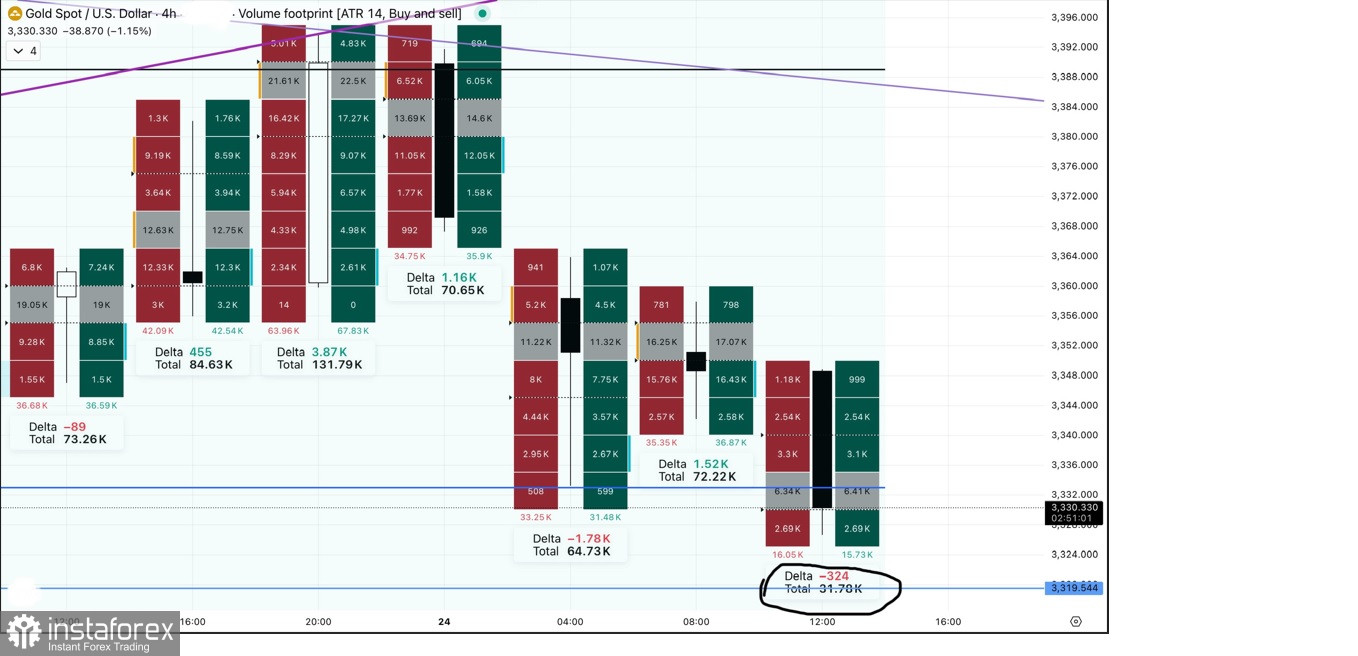
3.5.2. Footprint Chart Buyers & Seller.
From the Buyers and sellers, it appears that Sellers are quite dominant on the 4-hour chart. Gold currently has data from its Delta also showing a fairly large minus Seller position, which means that the breaks below the Value Area Low level from its Fix Volume Profile is quite significant.
3.5.3. Footprint Chart Delta with Cumulative Delta Volume indicator.
Here, appears a Divergence between the Footprint Chart and the Cumulative Delta Volume (CDV) indicator where the Footprint chart forms a higher-high, on the contrary the CDV indicator forms a Double Top.
4. Logic and Analysis Assessment.
4.1. What triggered the current decline in Gold?
Based on the facts above, especially with the appearance of Bearish Divergence between the movement of Gold prices with the Stochastic Oscillator indicator and the Footprint Chart Delta with the Cumulative Delta Volume (CDV) indicator, it is confirmed that today sellers are quite dominant in the current Gold market, especially with the total number of Buyers & Sellers which is much more than the Sellers on the Footprint Chart Buyers & Sellers where the Delta also confirms this with a minus value. so that the decline and the break of the Value Area Low Fixed Volume Profile seems quite valid.
4.2. Why are these levels important?
These levels are important because Pivot Points are using by almost all Daytraders and Scalpers around the world where the differences between each trader are not much different so that if each level is touched, it will create some actions that are almost simultaneous, so that it often causes the effect of "Self Fulfilling" Prophecy as occurs at the Fibonacci Ratio levels while the Low Value Area of the Fixed Volume Profile is so important because this is the lower limit of the Value Area 68% (sometimes rounded to 70%) of the average movement in the price range from Low to High selected on the current 4-hour Gold chart, so that when this level is successfully broken downwards there will be potential for a continuation of the weakening that occurs because in general the position of Buyers begins to decrease.
4.3. Is this weakening correction momentum prone to failure?
YES! Because the bias of gold is both from its Fundamental Trend (heating Geopolitics, uncertain World Financial Markets due to tariff wars) and its Technical Analyst Bias which is still Bullish (Golden Cross EMA 50 & 200).
5. Conclusion of Gold Technical Analysis today
With all the current technical analysis facts on the Gold commodity instrument, if Gold successfully breaks through and closes below the level of 3334.06, then Gold has the potential to continue its weakening to the level of 3315.69 and if the volatility and momentum of its weakening support it, Gold will continue its decline to the level of 3297.10 (Support.3).
6. Cancellation Conditions.
If Gold suddenly strengthens again today and closes above its Pivot level at 3369.64, if this level is successfully broken and closed above it, then all the previously described weakening correction scenarios will become invalid and automatically canceled.
7. Today's Economic Agenda:
7.1. CB Consumer Confidence (Jun) - 21:00 WIB.
7.2. Fed Chair Powell Testifies - 21:00 WIB.
8. Risk Note
This analysis is based on historical data and technical interpretation. There is no guarantee that the price movement pattern will repeat itself. Always use proper risk management.
9. Disclaimer
This analysis is for educational purposes only and does not constitute an investment recommendation or trading signal.