empty
08.05.2023 10:39 PM
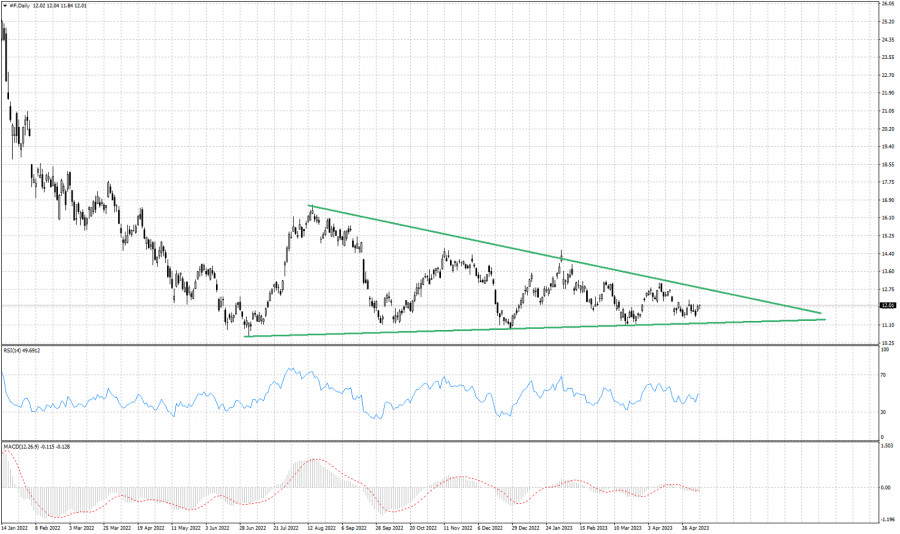
Ford stock price continues to trade inside a triangle pattern since last year.

This image is no longer relevant

Green lines- triangle pattern

Over the last 9 months, Ford's stock price has been trading in a relatively narrow range between $7.50 and $12.50. During this period, the stock has formed a triangle pattern on the daily chart, with the upper trendline connecting the highs and the lower trendline connecting the lows. The triangle pattern suggests that Ford's stock price is consolidating and that a breakout may be imminent. If the stock breaks above the upper trendline, it could signal a bullish continuation and a potential move towards the $13.50 to $14.00 range. On the other hand, if price breaks below the lower trendline, it could signal a bearish reversal and a potential move towards the $6.50 to $7.00 range. The Relative Strength Index (RSI) is currently hovering around the midpoint, indicating that the stock is neither overbought nor oversold. The Moving Average Convergence Divergence (MACD) indicator is also showing a neutral signal, with the MACD line and signal line crossing each other multiple times over the past few months. Overall, the technical outlook for Ford's stock price remains uncertain as it continues to trade within the triangle pattern. Traders and investors should keep a close eye on the upper and lower trendlines for potential breakout signals.

Summary
Urgency
Analytic
Alexandros Yfantis
Start trade
Earn on cryptocurrency rate changes with InstaForex
Download MetaTrader 4 and open your first trade
  • Grand Choice
    Contest by
    InstaForex
    InstaForex always strives to help you
    fulfill your biggest dreams.
    JOIN CONTEST

Recommended Stories

Stock market on August 11: S&P 500 and NASDAQ return to growth

Last Friday, US stock indices closed higher. The S&P 500 gained 0.78%, while the Nasdaq 100 added 0.97%. The industrial Dow Jones rose by 0.47%. Today, US and European stock

Jakub Novak 08:12 2025-08-11 UTC+2

Stock market on August 8: S&P 500 and Nasdaq see minor correction

As of yesterday's close, US stock indices finished mixed. The S&P 500 fell by 0.08%, while the Nasdaq 100 gained 0.35%. The Dow Jones Industrial Average declined by 0.51%. European

Jakub Novak 10:15 2025-08-08 UTC+2

US market on track for all-time highs. Focus on trade wars

US stock markets continue to climb. The euphoria of recent days is driven by several factors at once: strong corporate earnings, impressive news from Apple, and increasingly realistic expectations

Anna Zotova 15:10 2025-08-07 UTC+2

Stock market on August 7: SP500 and NASDAQ resume their rally

At the end of the previous trading day, US stock indices closed in the green. The S&P 500 rose by 0.73%, while the Nasdaq 100 gained 1.21%. The Dow Jones

Jakub Novak 09:03 2025-08-07 UTC+2

Stock market on August 6: S&P 500 and NASDAQ remain volatile

By the end of yesterday's session, US stock indices closed lower. The S&P 500 dropped by 0.49%, while the Nasdaq 100 lost 0.45%. The industrial Dow Jones slipped by 0.14%

Jakub Novak 09:36 2025-08-06 UTC+2

Stock Market on August 5: S&P 500 and NASDAQ recover some ground

At the close of trading on August 5, US stock indices regained part of Friday's losses. The S&P 500 rose by 1.47%, while the Nasdaq 100 added 1.95%

Jakub Novak 13:07 2025-08-05 UTC+2

US markets: key drivers, looming risks, and fresh incentive for Musk

US indices are once again charging toward record highs. After a tense week, when the market stumbled over trade wars and a weak labor market, the momentum is shifting back

Anna Zotova 13:07 2025-08-05 UTC+2

Stock Market on August 4: SP500 and NASDAQ plunge

At the close of trading yesterday, US stock indices ended in the red. The S&P 500 fell by 1.60%, while the Nasdaq 100 dropped by 2.24%. The Dow Jones Industrial

Jakub Novak 10:50 2025-08-04 UTC+2

S&P 500 Forecast for August 4, 2025

A divergence has formed on the monthly chart of the S&P 500. The entire growth of the index from March 2020 to July 2025 fits neatly into the Fibonacci grid

Laurie Bailey 05:01 2025-08-04 UTC+2

US stock market poised to pull back after three months of steady rally

July ends with another victory for the bulls: the S&P 500 closed higher for a third consecutive month, reaching a new all-time high at 6,427. But the triumph feels tainted

Anna Zotova 12:39 2025-08-01 UTC+2
Can't speak right now?
Ask your question in the chat.
Widget callback
 

Dear visitor,

Your IP address shows that you are currently located in the USA. If you are a resident of the United States, you are prohibited from using the services of InstaFintech Group including online trading, online transfers, deposit/withdrawal of funds, etc.

If you think you are seeing this message by mistake and your location is not the US, kindly proceed to the website. Otherwise, you must leave the website in order to comply with government restrictions.

Why does your IP address show your location as the USA?

  • - you are using a VPN provided by a hosting company based in the United States;
  • - your IP does not have proper WHOIS records;
  • - an error occurred in the WHOIS geolocation database.

Please confirm whether you are a US resident or not by clicking the relevant button below. If you choose the wrong option, being a US resident, you will not be able to open an account with InstaForex anyway.

We are sorry for any inconvenience caused by this message.