BTC/USD Analysis: A Comprehensive Market Outlook
Overview of Bitcoin's Market Movements as of January 15, 2024
Bitcoin, the pioneering cryptocurrency, has recently witnessed a notable decline from its peak around USD 49,000, marking a more than 15% correction. Presently, Bitcoin stabilizes at USD 43,000, while Ethereum trades around USD 2,500. This shift follows a period of intense anticipation and activity in the crypto market, particularly around the acceptance of ETF (Exchange Traded Fund) applications by the SEC.
Key Takeaways
- Bitcoin's recent correction is a result of profit-taking following the ETF debut.
- Future market directions may be influenced by global sentiment and the dollar index.
- Key levels to watch are between USD 33,000 and USD 38,000 for potential support.
Cryptocurrency Market Dynamics
The introduction of ETF funds, although successful in trading volumes, has not led to a definitive strategy among institutions regarding BTC accumulation. The SEC's approval is seen as positive, potentially attracting more U.S. investors. However, Bitcoin's recent decline partly stems from the liquidation of holdings by investors from the Grayscale Bitcoin Trust (GBTC), driven by high fees and the option to sell at market prices after the fund's conversion to an ETF.
Technical Market Outlook
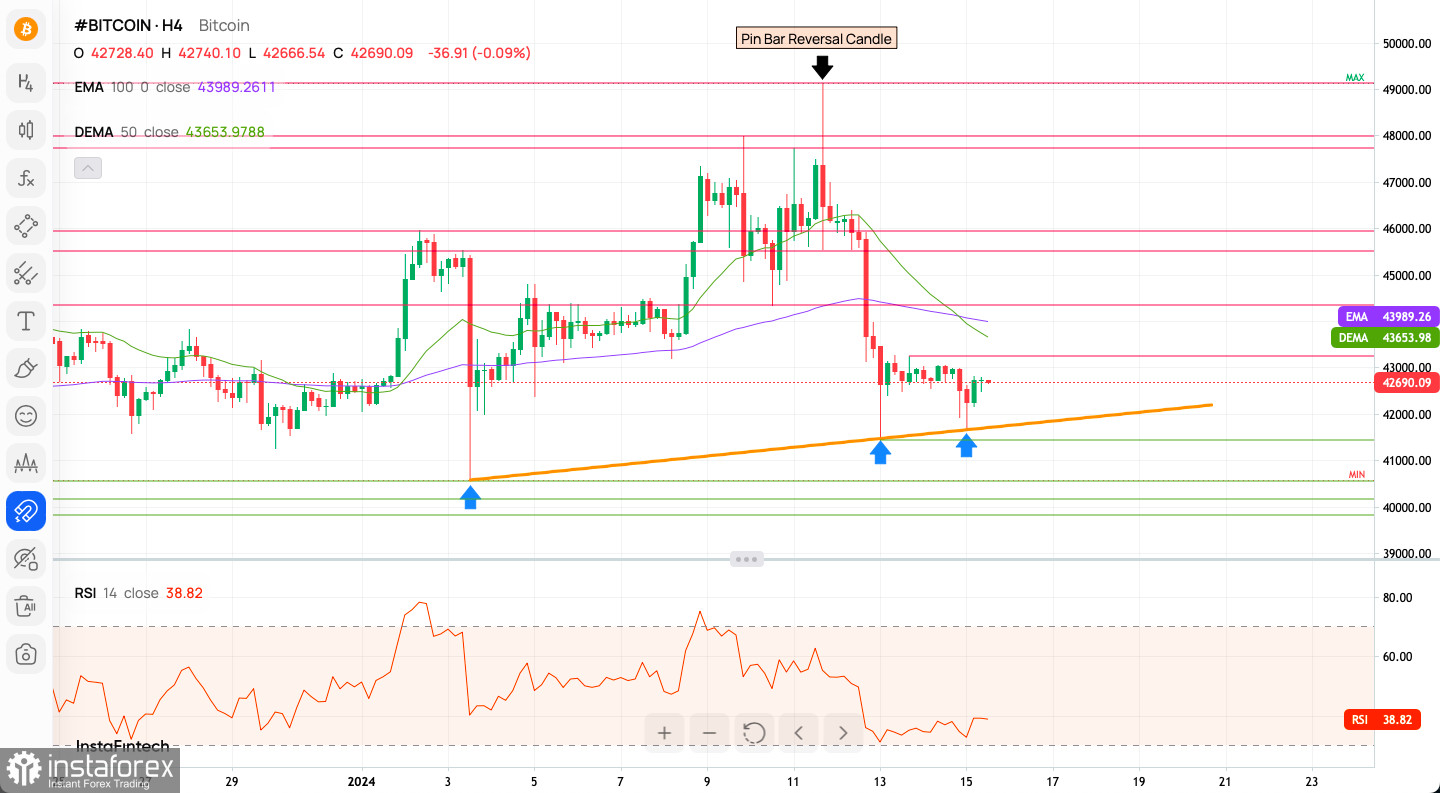
BTC/USD reached a yearly high of $49,126 but then reversed, indicated by a Pin Bar reversal candle. The next bull target is set at $50,000. However, given the recent -15.50% drop, reaching this level might take time. Intraday technical support is at $41,643, with resistance at $43,249 and $44,385.
Intraday Indicator Signals
- Majority of technical indicators (12 out of 23) show a Buy signal.
- More than half of the moving averages (11 out of 18) suggest a Buy signal.
Sentiment Scoreboard
The overall sentiment remains bullish (74% vs. 23% bears), with consistent bullishness over the last week and three days, although there has been a slight shift towards bearish sentiment in the most recent period.
Monthly Pivot Points
These pivot points serve as crucial markers for identifying potential trend reversals and key support and resistance levels in financial markets:
- Resistance 3 (WR3) at $60,342
- Resistance 2 (WR2) at $52,233
- Resistance 1 (WR1) at $47,421
- Pivot Point at $44,125
- Support 1 (WS1) at $39,312
- Support 2 (WS2) at $36,015
- Support 3 (WS3) at $27,908
Weekly Time Frame Analysis
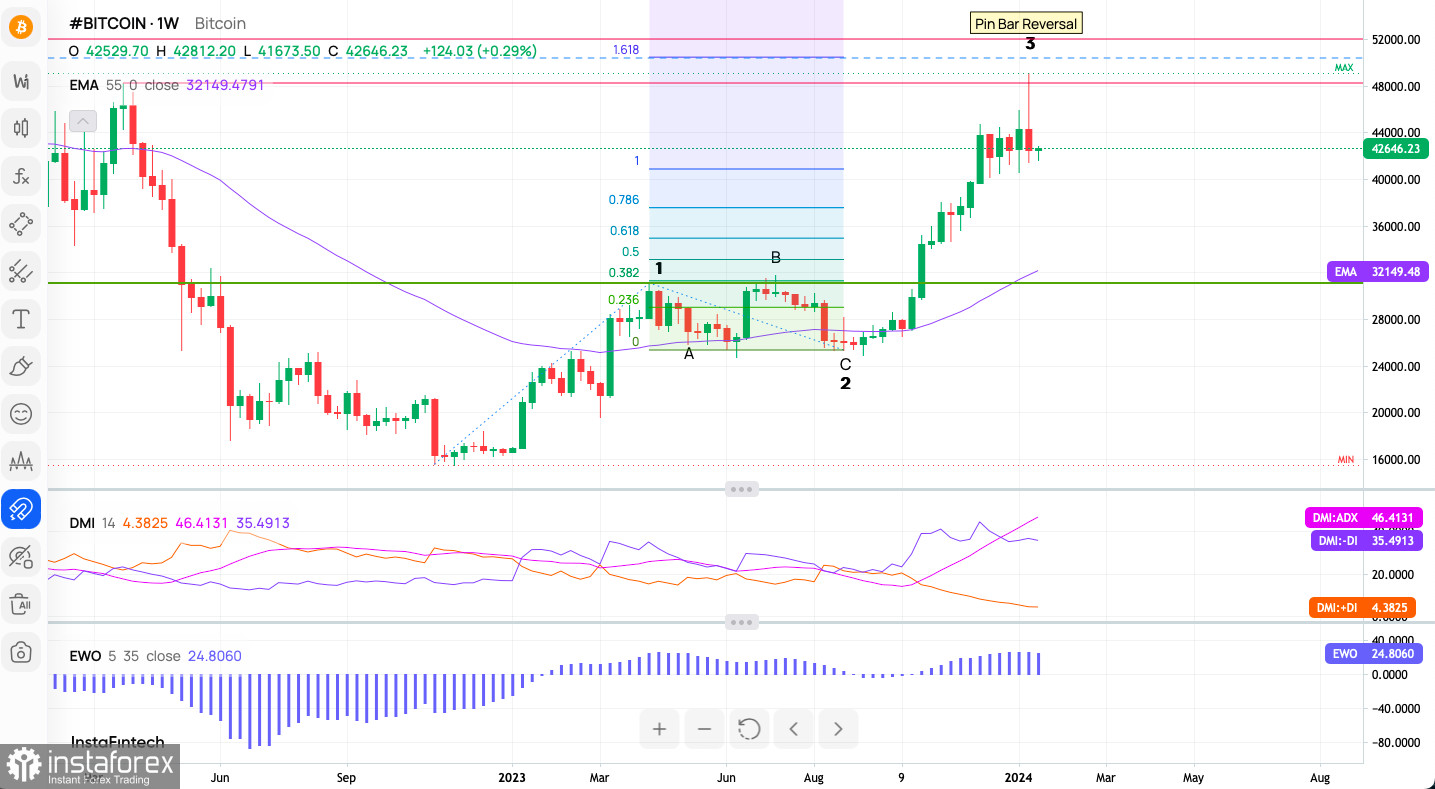
The weekly chart analysis indicates that the upward trend is still within market geometry, but there's a break below the 9 SMA, suggesting a potential period of weakness. If this downtrend continues, the focus turns to the $33,000 - $38,000 range, significant for short-term addresses. Alternatively, maintaining current levels could lead to consolidation and a possible uptrend continuation.
Elliott Wave and Fibonacci Analysis
The Elliott Wave pattern, shown as waves A, B, and C, suggests an ABC correction following an impulsive wave 3. The upward movement after the C wave could indicate the start of a new impulsive wave. A key level to watch is the 161% Fibonacci extension at around $50,300, typically associated with wave 3 in Elliott Wave Theory.
Trading Insights
- A reversal or consolidation is indicated by the Pin Bar reversal pattern near the resistance area.
- The Directional Movement Index (DMI) signals a strong trend with the ADX above 25 and the DI+ line above the DI- line.
- The Elliott Wave Oscillator (EWO) shows increasing positive momentum, supporting the bullish price action.
Conclusion: Balancing Optimism with Caution
The BTC/USD pair's current market sentiment is bullish in the mid to long term, bolstered by strong momentum indicators. However, the presence of
a Pin Bar reversal pattern suggests potential short-term retracement or consolidation. Traders should watch for the market's response at the significant Fibonacci extension level and the behavior around key moving averages for further trend confirmation.
For Bullish Traders: An upward movement past the 161% Fibonacci level, supported by strong momentum indicators, could indicate a continuation of the bullish trend. Maintaining levels above key moving averages would further bolster this outlook.
For Bearish Traders: A reversal indicated by the Pin Bar pattern, especially if accompanied by a breakdown below key support levels and moving averages, could signal a shift towards a bearish trend. Monitoring the market's reaction to these technical levels is crucial.
Useful Links
Important Notice
The begginers in forex trading need to be very careful when making decisions about entering the market. Before the release of important reports, it is best to stay out of the market to avoid being caught in sharp market fluctuations due to increased volatility. If you decide to trade during the news release, then always place stop orders to minimize losses.
Without placing stop orders, you can very quickly lose your entire deposit, especially if you do not use money management and trade large volumes. For successful trading, you need to have a clear trading plan and stay focues and disciplined. Spontaneous trading decision based on the current market situation is an inherently losing strategy for a scalper or daytrader.
#instaforex #analysis #sebastianseliga