The US stock market continues to maintain its upward momentum, yet the atmosphere is increasingly charged with anticipation. Wednesday's inflation report and corporate earnings from key players are setting the stage for heightened volatility.
Optimism persists, but it is no longer unconditional: investors stand ready to shift gears quickly if the data fails to support the prevailing narrative. In the coming sessions, the market may either accelerate its rally on the back of "soft" inflation readings or retreat sharply to early-month levels, depending on the figures and headlines.
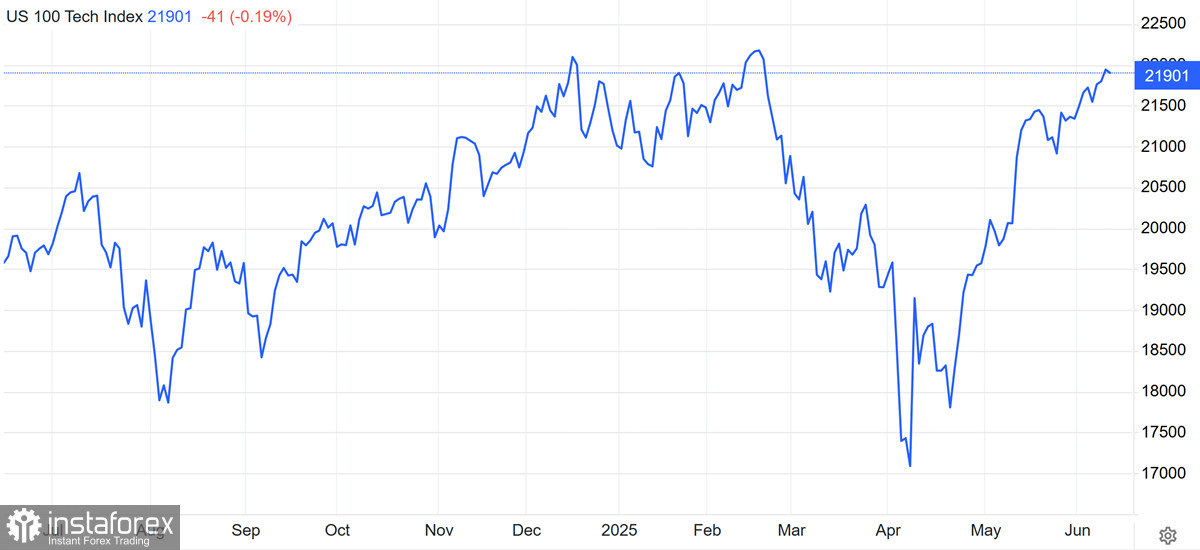
At midweek, US equities are hovering near fresh highs. The S&P 500 is consolidating around 6,030, while the Nasdaq 100 has climbed to 21,920. Futures on the indices are showing slight corrections on Wednesday, reflecting investor caution ahead of the key inflation print.
On Tuesday, major indices closed the trading session firmly in positive territory: the S&P 500 added 0.55%, and the Nasdaq gained 0.63%. This marked the third consecutive session of gains, signaling sustained risk appetite despite a tense news environment.
Gains were broad-based: 10 of the 11 S&P sectors finished in the green, led by energy, consumer discretionary, and healthcare. Tech giants performed particularly well. Thus, Tesla surged 5.7% on upbeat delivery news, while Meta and Alphabet also advanced.
Investors continue to monitor trade talks between the US and China. Commerce Secretary Howard Lutnick described the discussions as "really good," allowing markets to temporarily dial back geopolitical concerns.
Still, specifics remain scarce, and markets are demanding not just reassuring rhetoric but concrete actions, particularly regarding the supply of rare earth elements and technologies crucial to many US IT firms.
Corporate earnings remain in focus. After today's close, results are due from Oracle and Chewy. Oracle is a flagship in cloud solutions and enterprise software, particularly with its buildout of AI infrastructure. Chewy serves as a key gauge of consumer spending in e-commerce and the pet segment. Positive earnings from both could reinforce market momentum, especially if paired with moderate inflation data.
Technical picture
The S&P 500 has confidently broken through the psychological 6,000 mark, now trading at new record highs. Immediate resistance is seen in the 6,070–6,100 area, while support has shifted to the 5,980–5,950 zone. The RSI is nearing overbought territory but has not yet triggered a pullback signal. However, any disappointing inflation surprise could prompt a decline toward 5,900.
The Nasdaq 100 continues to outpace the broader market, reflecting capital inflows into the tech sector. Resistance is seen at 22,000–22,100, with a breakout opening the way to 22,500. Support sits at 21,500, a critical level for short-term momentum. The trend remains bullish for now, but lofty expectations leave the market vulnerable to a correction.
Nike: rare surge on trade hopes
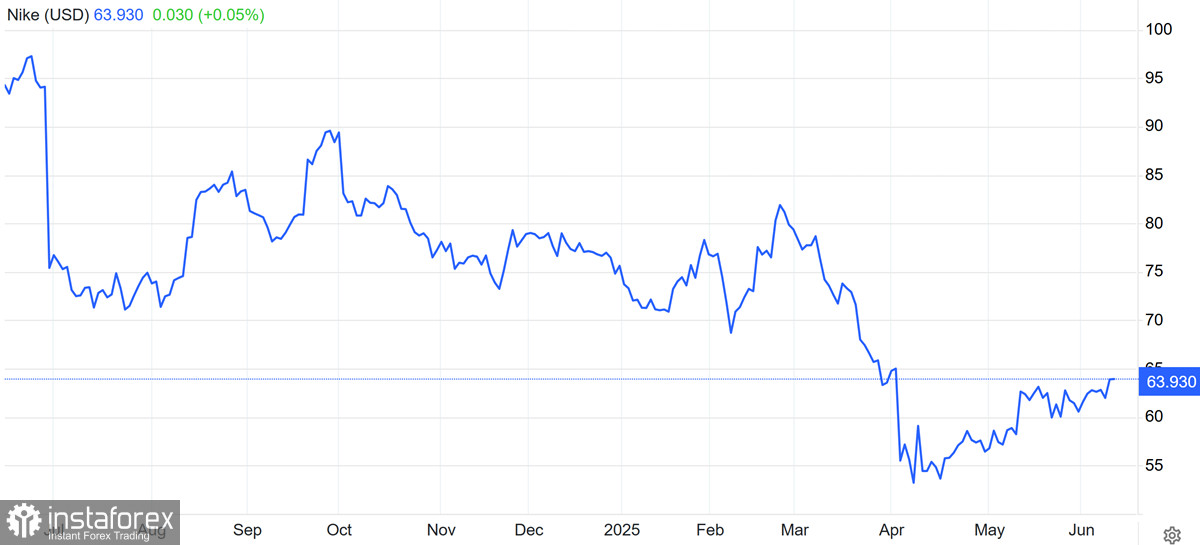
Nike (NKE) shares jumped 3.2% on Tuesday, leading gains in the industrial index, a position the stock has not held for quite some time. This is particularly notable, considering that from November 2021 to April 2024, the company's market capitalization shrank by nearly 70%, relegating Nike to the ranks of underperformers.
The growth catalyst arrived unexpectedly: positive commentary on US-China trade talks. For Nike, whose business is deeply tied to China both as a manufacturing hub and consumer market, this comes as welcome relief. Tensions in US-China relations have been a major headwind for the company's shares over the past two years.
For now, this is only a modest rebound from multi-month lows, but the market's swift response highlights just how sensitive investors are to any positive developments in trade relations. Should talks continue to progress and a constructive backdrop remain, Nike may attempt a return to the $68–70 range, where prior consolidation occurred.
Technical picture
On the daily chart, Nike shares are attempting to form a local bottom after an extended downtrend. Immediate resistance is located around $65.50–66.00, aligning with the 50-day simple moving average (SMA50) and a local reversal zone seen in late May.
A breakout above this level on strong volume may open the path to more significant resistance at $68.00–70.00, where consolidation occurred in February–March. Support remains in the $61.00–62.00 range. A breakdown below would increase selling pressure, potentially dragging the stock back to the $58.00–59.00 zone, which marked the April lows. Falling below this area would push the stock back into a vulnerable position.
Nike is currently in a recovery phase, but the technical trend remains downward. A confirmed breakout above $70 on strong volume would be required to signal a true trend reversal. For now, this remains more of a speculative interest than a sustained recovery.