EUR/USD 5-Minute Analysis
As expected, the EUR/USD currency pair began recovering after Tuesday's decline. As previously noted in today's articles, we are not evaluating the outcome of the Federal Reserve meeting or the market's reaction to it. We believe it's necessary to wait until midday Thursday to draw meaningful conclusions about this event. Only then will traders in both the Eurozone and the U.S. be able to fully assess the meeting results, the decisions made, and the forecasts issued. As we've said before, it's common for the price to initially move in one direction following such a significant event, only to return to its original position over the next 10–20 hours.
On Wednesday, there were no significant reports from the U.S. or the EU. The Eurozone released its second inflation estimate for May, but it was identical to the first, more significant estimate. The Consumer Price Index in Europe slowed to 1.9% y/y, allowing the European Central Bank to continue easing monetary policy—albeit probably slower. In any case, policy easing by the ECB is not an issue for the euro. The euro has been rising for five months, and at this point, it's unclear what could stop this trend. The price failed to consolidate below the Senkou Span B line, so the upward trend remains intact despite breaching the trendline.
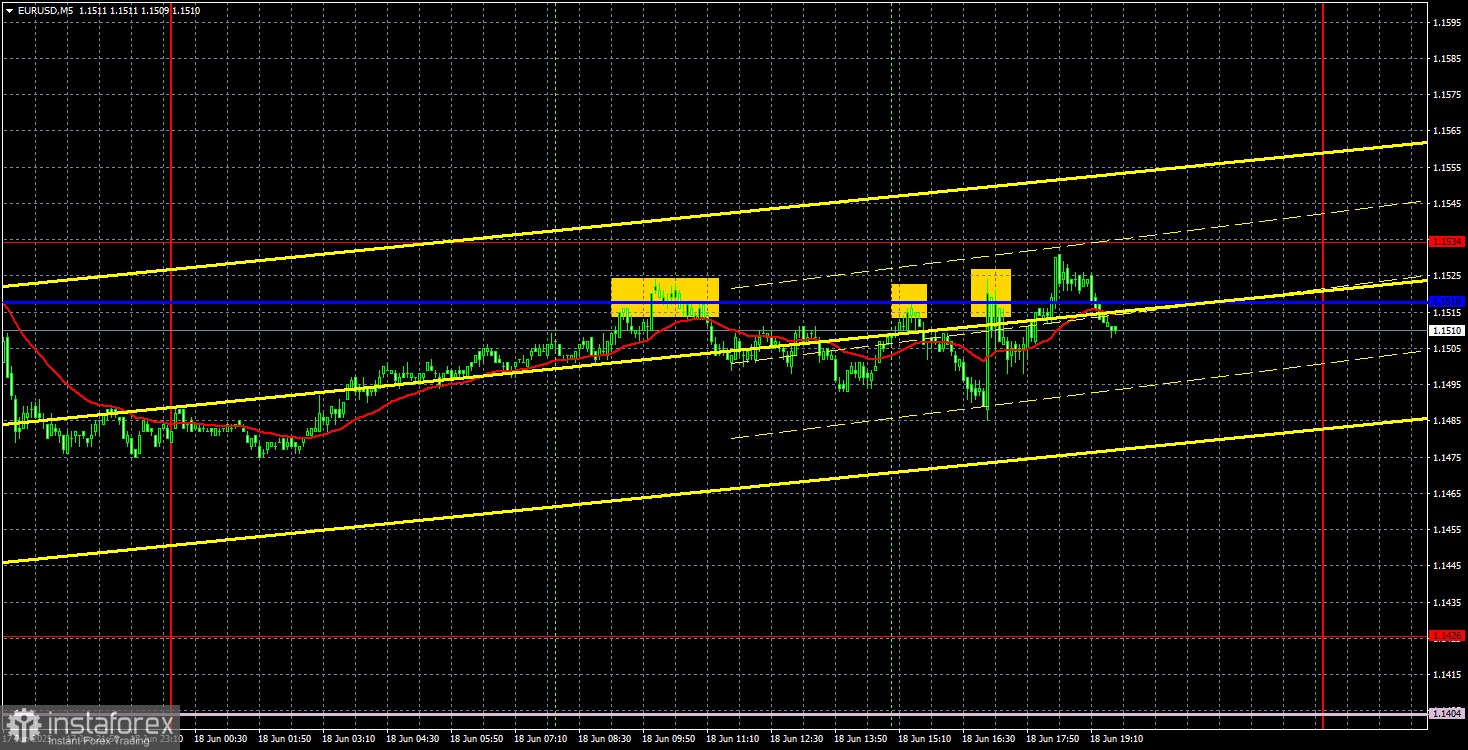
In the 5-minute timeframe, the pair was flat all day until the evening. It bounced thrice from the critical line without falling more than 15–20 pips. Thus, no losses were possible on any short positions, and entering the market in the evening, just before the Fed meeting, was likely inadvisable.
EUR/USD 1D Chart Analysis – ICT
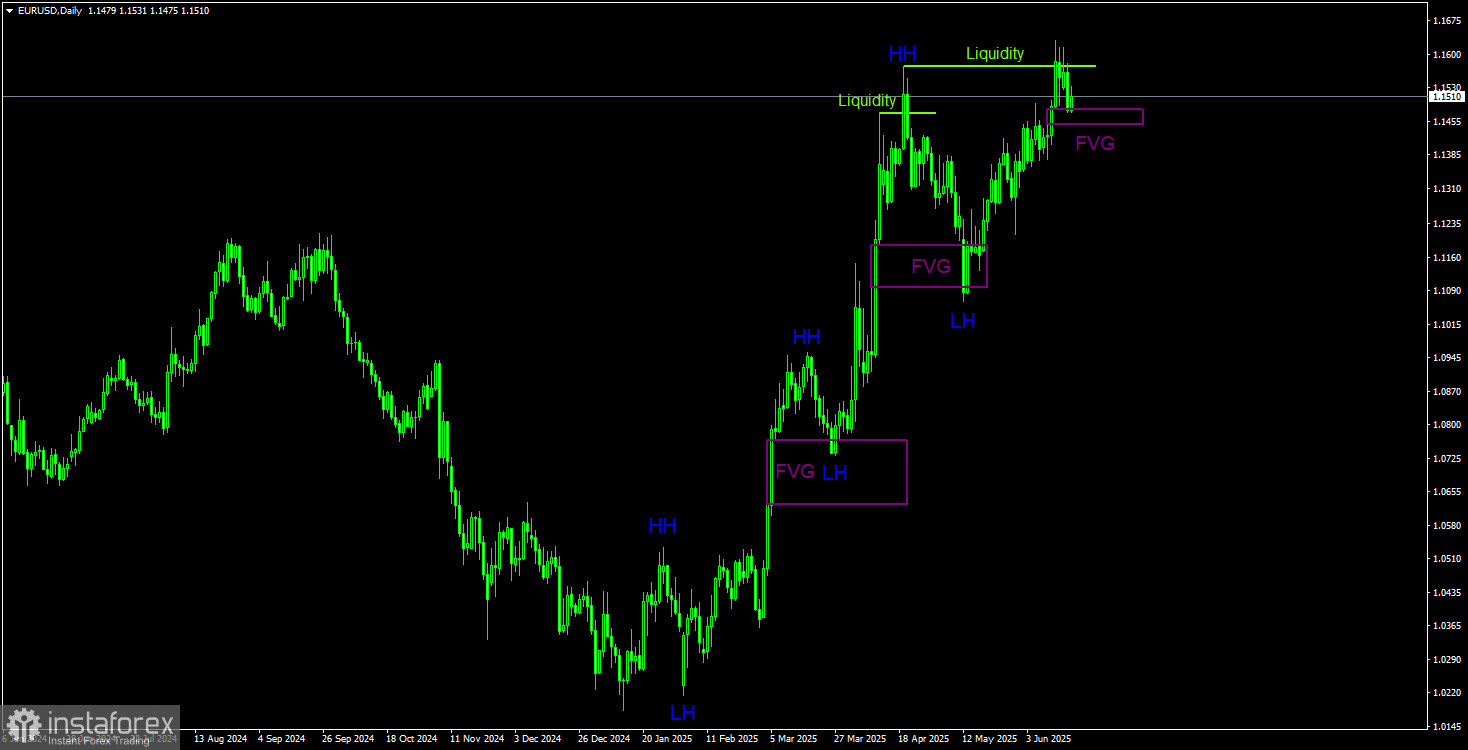
In the long term, we see a clear uptrend. Of course, this uptrend will end someday, but the only current signal for a potential drop is the liquidity grab from the last higher high (HH). On the bullish side, we have a bullish Fair Value Gap (FVG) zone. A bounce from this zone, confirmed on lower timeframes, would indicate the resumption of the euro's growth. The uptrend remains valid as long as the price stays above the 1.1100 level. This means the dollar could even strengthen by a few hundred points without changing the broader trend. Fundamentally, the backdrop continues to work against the U.S. dollar.
COT Report
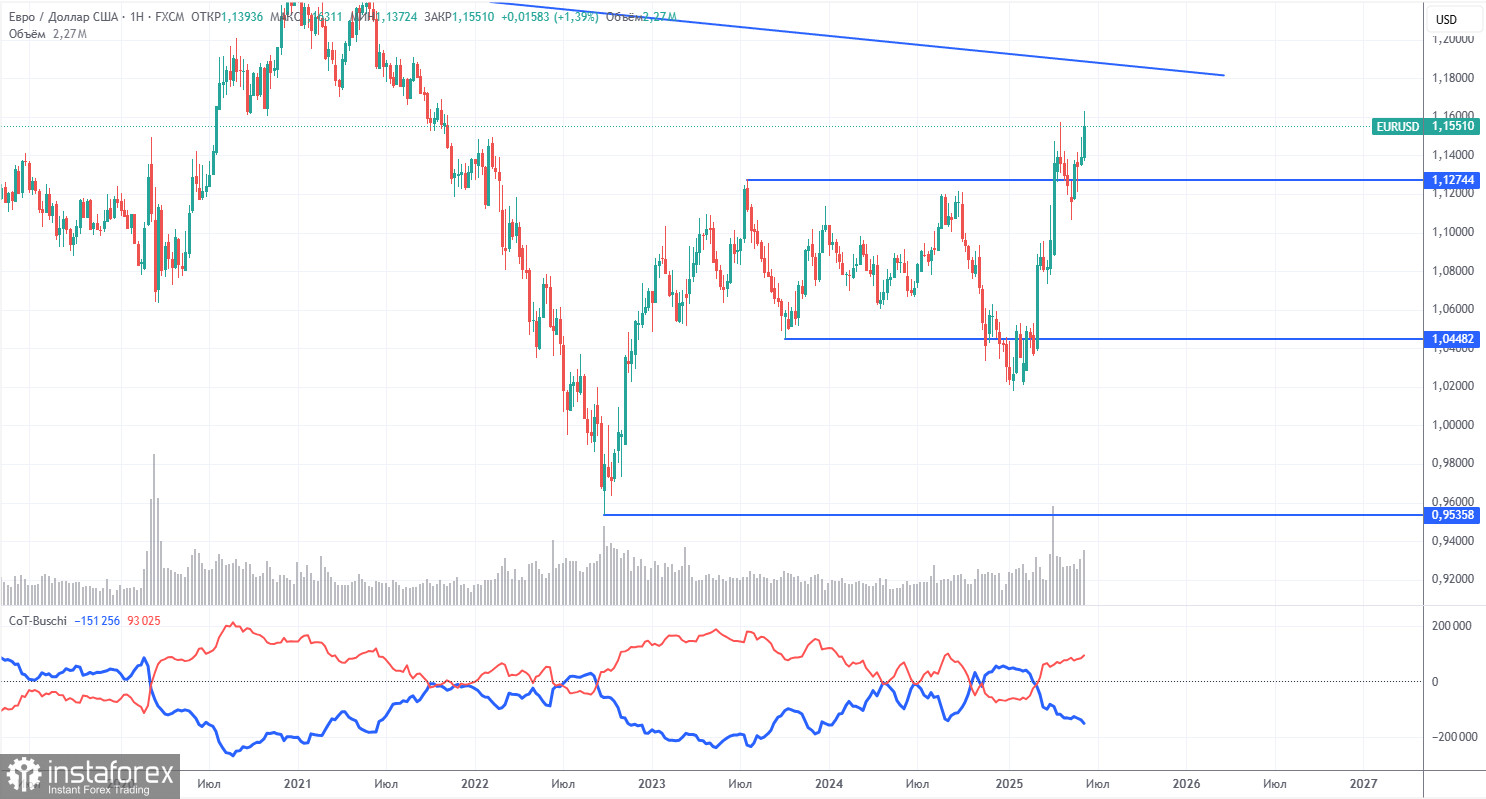
The latest COT report is dated June 10. As shown in the chart above, the net position of non-commercial traders has been bullish for a long time. Bears gained the upper hand briefly at the end of 2024 but quickly lost it. Since Trump assumed the U.S. presidency, the dollar has done nothing but decline.
We can't say with 100% certainty that the dollar will continue to fall, but current global developments suggest that it will.
We still don't see any fundamental drivers supporting the euro, but one strong reason remains for continued dollar weakness. The global downtrend is still in place, but who cares about the 16-year price history now? If Trump ends his trade wars, the dollar may start to rise again — but will he ever end them? And when?
The red and blue lines have crossed again, meaning the market trend has become bullish again. During the latest reporting week, long positions in the "Non-commercial" group rose by 6,000, while short positions declined by 4,300. Therefore, the net position increased by 10,300 over the week.
EUR/USD 1-Hour Analysis
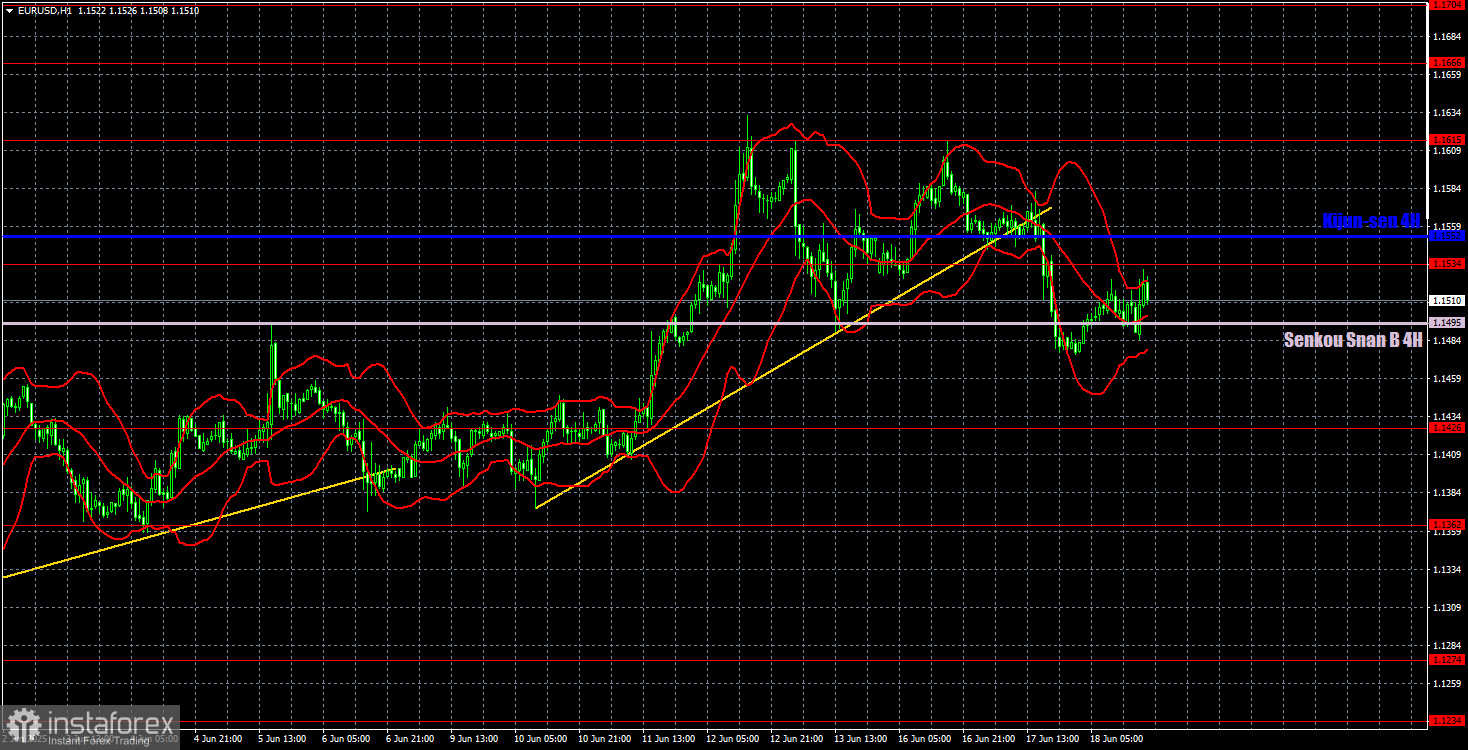
The EUR/USD pair retains a local bullish bias in the hourly chart despite breaking through several upward trendlines. The price hasn't consolidated below any Ichimoku indicator lines, so we've seen another weak correction. As before (over the past five months), the market mainly reacts to events related to Trump, his decisions, and his trade war. Now, this already challenging situation has been further complicated by a full-scale war in the Middle East. There are no positive headlines—only negative ones. As a result, the dollar continues to depreciate, which is very favorable for Donald Trump.
For June 19, we highlight the following levels for trading: 1.1092, 1.1147, 1.1185, 1.1234, 1.1274, 1.1362, 1.1426, 1.1534, 1.1615, 1.1666, 1.1704, and 1.1750, as well as the Senkou Span B line (1.1495) and the Kijun-sen line (1.1552). Ichimoku indicator lines may shift during the day and should be considered when identifying trading signals. Don't forget to set a Stop Loss to breakeven if the price moves 15 pips in the right direction. This helps avoid losses in case of a false signal.
Two speeches by ECB President Christine Lagarde are scheduled for Thursday in the Eurozone. We believe Lagarde is unlikely to provide any major new information since the last ECB meeting occurred quite recently, and no significant changes in policy, trade, geopolitics, or economics have occurred since then. The U.S. macroeconomic calendar is empty.
Illustration Explanations:
- Support and resistance price levels – thick red lines where movement may end. They are not trading signal sources.
- Kijun-sen and Senkou Span B lines—These are strong Ichimoku indicator lines transferred to the hourly timeframe from the 4-hour one.
- Extremum levels – thin red lines where the price has previously rebounded. These act as trading signal sources.
- Yellow lines – trend lines, trend channels, and other technical patterns.
- COT Indicator 1 on the charts – the size of the net position for each category of traders.