EUR/USD
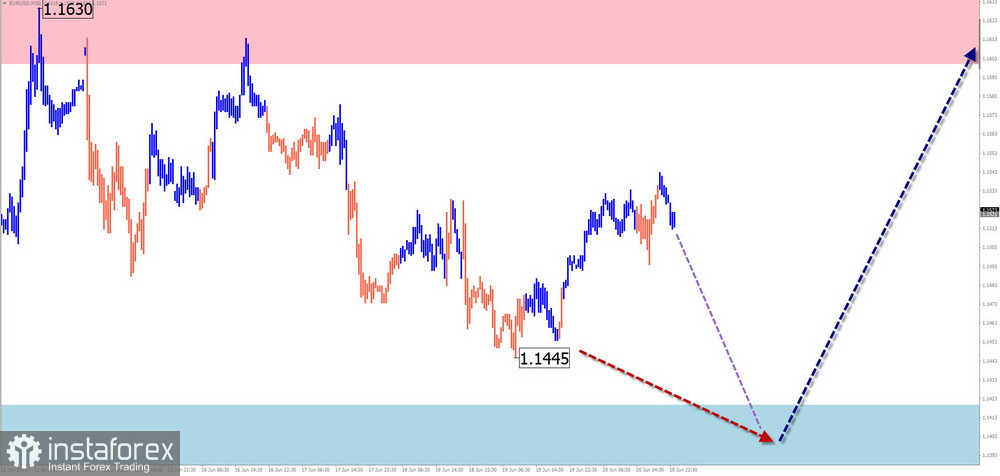
Forecast for the Coming Days:Sideways movement is expected to continue. Near the projected support zone, there is a high probability of a pause and the formation of conditions for a reversal. An upward price movement is most likely toward the end of the week.
Analysis: Since early February of this year, the direction of price fluctuations in the euro major has followed a bullish wave pattern. Since April 11, a counter-wave has been forming, mostly within a horizontal plane. The bearish segment lacks reversal potential and remains within the bounds of a correction to the last part of the trend. The wave structure resembles a "horizontal pennant."
Potential Reversal Zones:
- Resistance: 1.1600 / 1.1650
- Support: 1.1420 / 1.1370
Recommendations:
- Sell: Possible with a reduced volume during individual sessions, with targets not exceeding the support zone.
- Buy: Can be considered after reversal signals appear near the support zone according to your trading system (TS).
USD/JPY
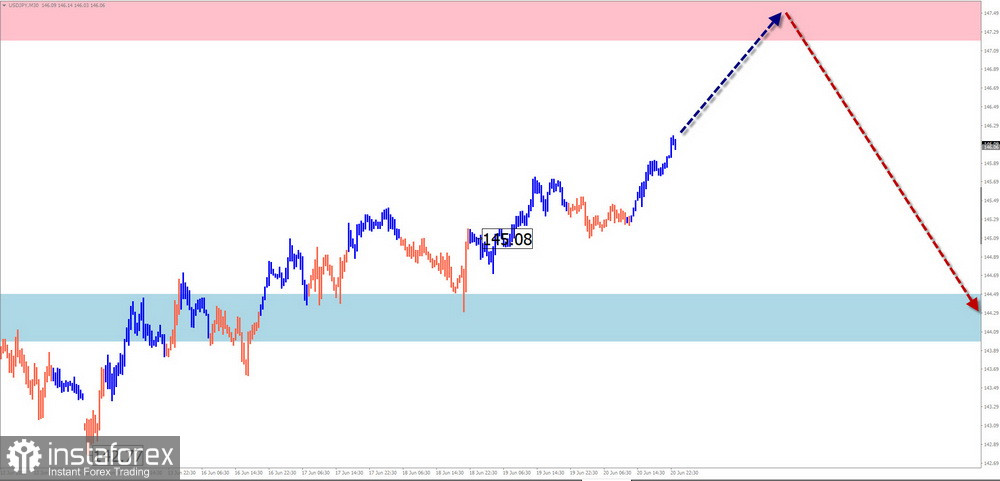
Analysis: Since the beginning of last year, price movements in the yen major have followed a dominant, ongoing bearish wave. Since mid-May, the final segment (C) has been unfolding, forming an intermediate sub-wave. Prices are approaching the lower boundary of the potential reversal zone, which acts as resistance.
Forecast: The upward trend is expected to continue throughout the week until it reaches the projected resistance zone. Toward the weekend, a reversal and renewed decline are possible, but limited to the support boundaries. A sudden spike in volatility may accompany the trend change.
Potential Reversal Zones:
- Resistance: 147.50 / 163.00
- Support: 144.50 / 144.00
Recommendations:
- Sell: Premature without confirmed reversal signals in the resistance level.
- Buy: Could be the main trading direction for the coming days; reducing volume size is advisable.
GBP/JPY
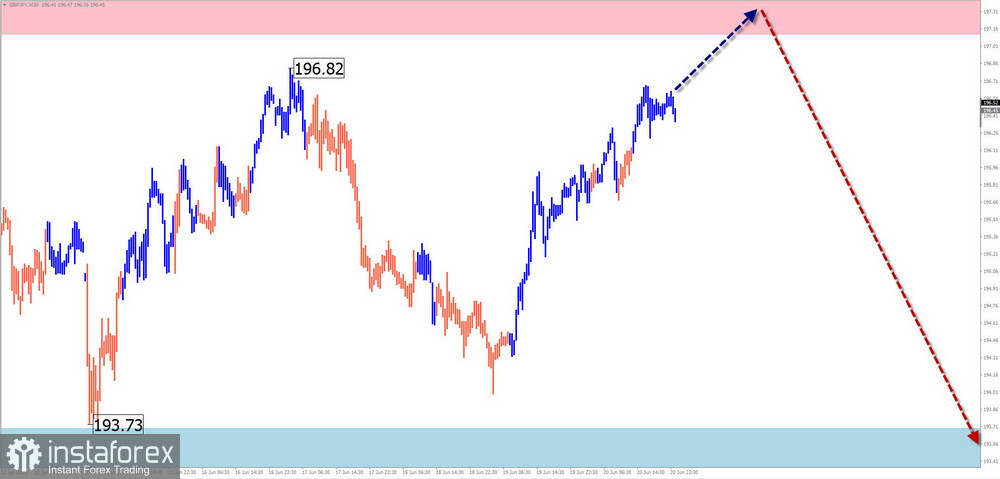
Analysis: In the short term, the ongoing bearish wave for the GBP/JPY pair has been developing since mid-May. Prices are approaching the lower boundary of a broad potential reversal zone on the weekly timeframe. The structure currently shows no signs of completion. No imminent trend change is evident on the chart.
Forecast: A continued upward movement is likely over the next couple of days, reaching the resistance zone. Afterwards, sideways movement near this area may occur, with brief pressure on the upper boundary. A trend reversal could happen by the end of the week. Downward movement will likely be limited by the support zone.
Potential Reversal Zones:
- Resistance: 197.10 / 197.60
- Support: 193.70 / 193.20
Recommendations:
- Sell: Can be used during individual sessions once confirmed signals appear in your trading system.
- Buy: Risky and potentially unprofitable.
USD/CAD
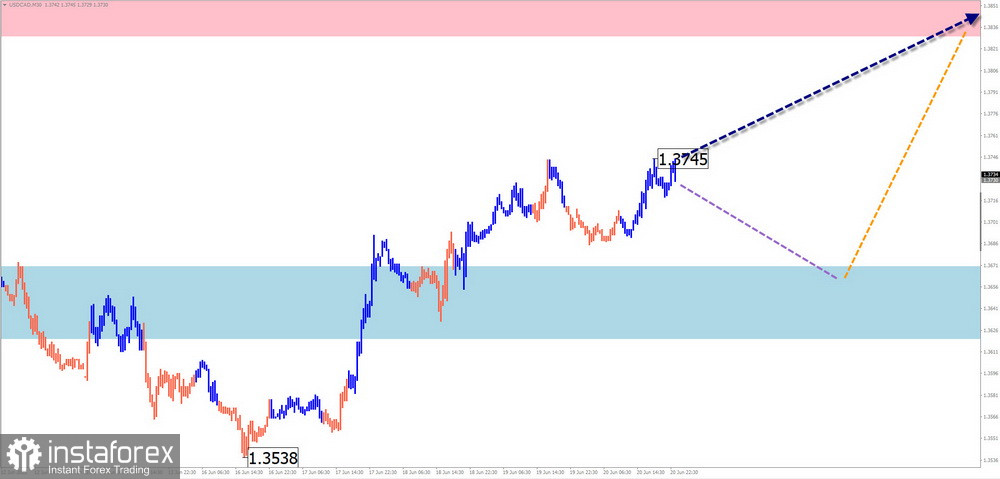
Analysis: The bearish wave seen over the last four months in the Canadian dollar chart has reached a cluster of potential reversal zones across different timeframes. The current wave structure shows that the middle part (B) remains incomplete and is forming as an extended flat. In recent days, a pullback has been developing as part of the final wave segment.
Forecast:Further decline toward the projected support zone is expected in the coming days. A reversal and upward price movement may follow. The resistance zone marks the upper boundary of the pair's expected weekly volatility.
Potential Reversal Zones:
- Resistance: 1.3830 / 1.3880
- Support: 1.3670 / 1.3620
Recommendations:
- Sell: Possible intraday with small volumes, limited to the support zone.
- Buy: Consider after confirmed reversal signals appear near the support zone.
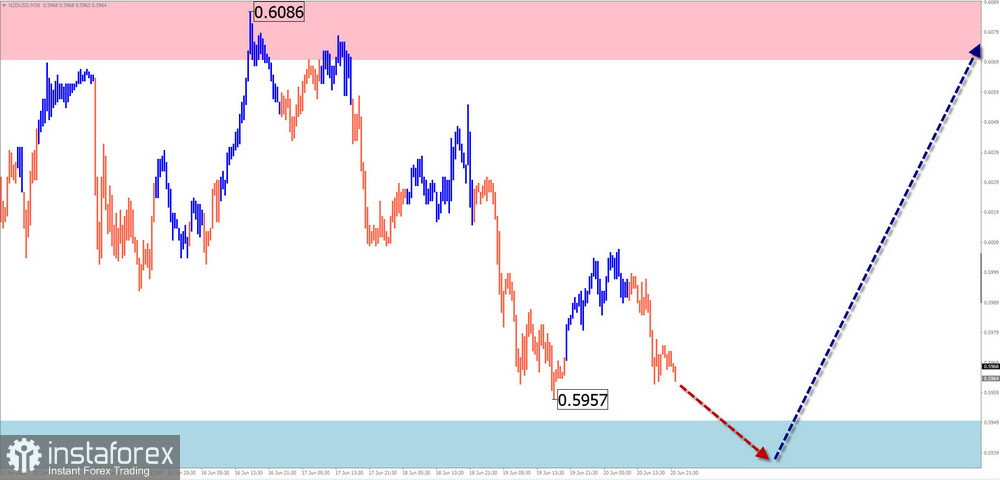
NZD/USD
Brief Analysis:The New Zealand dollar remains within a dominant bullish wave since April, forming the basis of a larger uptrend. The current downward segment has been developing since late April and remains within the bounds of internal correction.
Weekly Forecast:The downward trend is likely to continue for a few more days. Near the projected support zone, the price may shift to a sideways trend with conditions forming for a reversal. A return to upward movement is more likely in the second half of the week.
Potential Reversal Zones:
- Resistance: 0.6070 / 0.6120
- Support: 0.5950 / 0.5900
Recommendations:
- Sell: Low potential and may carry significant risk.
- Buy: Can be used after reversal signals appear in the support zone.
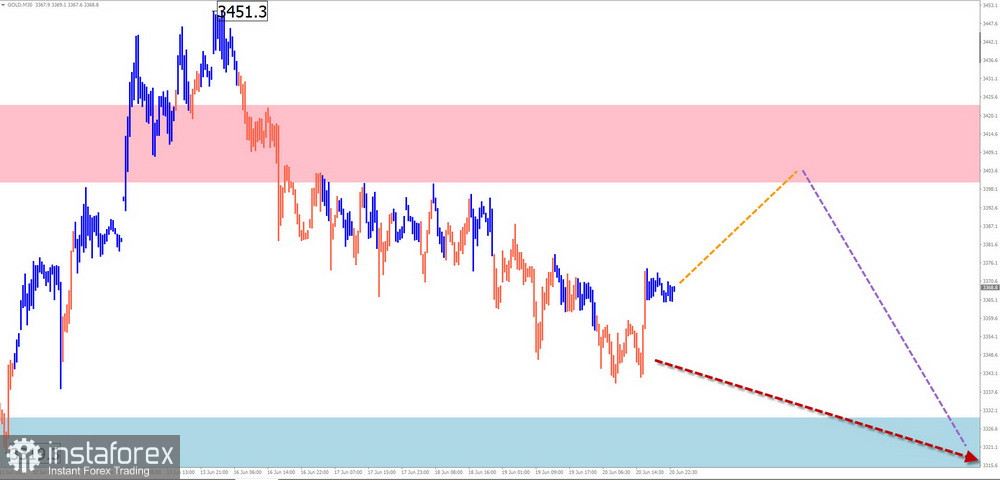
GOLD (XAU/USD)
Analysis:Since April, gold has mostly moved sideways. The current bearish flat is a correction of the previous bullish trend. Since June 16, the final corrective segment (C) has been forming. Over the past week, prices have been adjusting within this wave.
Forecast:A short-term rise is expected in the coming days, possibly testing the resistance zone. After that, a reversal and renewed decline are likely. Increased volatility is expected closer to the weekend.
Potential Reversal Zones:
- Resistance: 3400.0 / 3420.0
- Support: 3330.0 / 3310.0
Recommendations:
- Buy: Low potential, high risk.
- Sell: Consider as the primary trading direction after reversal signals appear near the resistance zone according to your TS.
Explanation: In Simplified Wave Analysis (SWA), all waves consist of 3 parts (A-B-C). The analysis on each timeframe focuses on the last, unfinished wave. Dashed lines show projected movements.
Note: The wave algorithm does not account for the duration of instrument movements over time!