EUR/USD 5-Minute Analysis
The EUR/USD currency pair traded very weakly and sideways throughout Friday. There were no macroeconomic or fundamental drivers that day, so the market went into the weekend early. Over the weekend, it became known that the U.S. carried out its first official strike on Iran with its forces since 1979. The attack targeted nuclear facilities, three of which, according to Trump, were completely destroyed. Iran immediately declared that all American military personnel—and even civilians—within the country are now considered "legitimate targets." Likely, Iran will soon retaliate against the U.S. by striking its military bases in the region. Terrorist attacks within the U.S. cannot be ruled out either. One way or another, the U.S. has now officially entered into war against Iran, something Trump had tried to avoid until the last moment.
Thus, we believe the dollar may strengthen today—unless the market interprets the event as negative for the U.S. dollar. The situation is ambiguous. On the one hand, it represents an escalation of a geopolitical conflict, and in such cases, the dollar often rises as a "safe-haven asset." On the other hand, the U.S. itself is now a party to the conflict. Monday is likely to be very turbulent and eventful, with high volatility.
Technically speaking, the price remains above the Senkou Span B line, but the news is currently so strong that technical factors are of secondary importance. The upward trend persists, but we wouldn't be surprised if it ends on Monday.
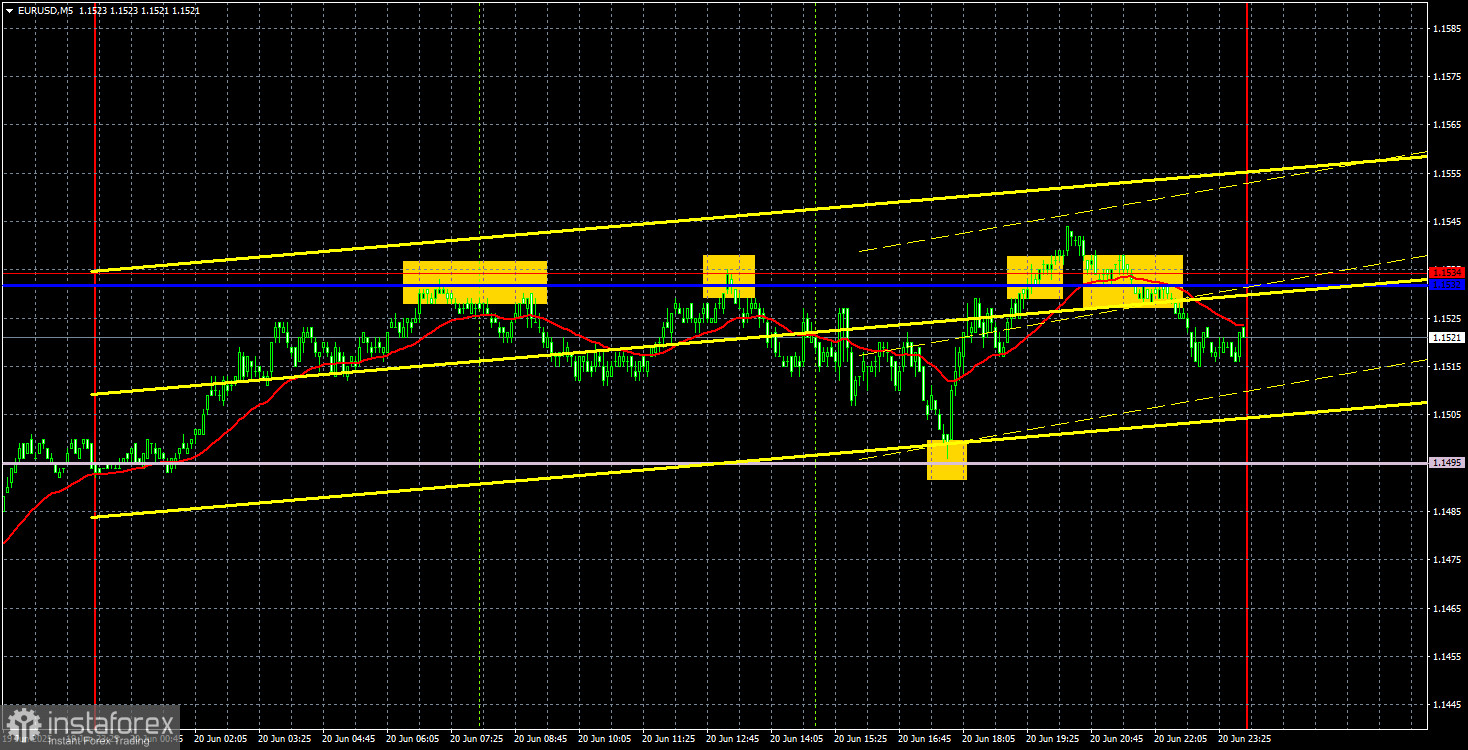
On the 5-minute TF, several good trading signals were formed on Friday despite the sideways market. The price rebounded twice from the 1.1532–1.1534 area during the European session and once from the Senkou Span B line during the U.S. session. In all cases, the nearest targets were reached. Traders could have opened two trades—both of which were profitable.
EUR/USD 1D Analysis – ICT
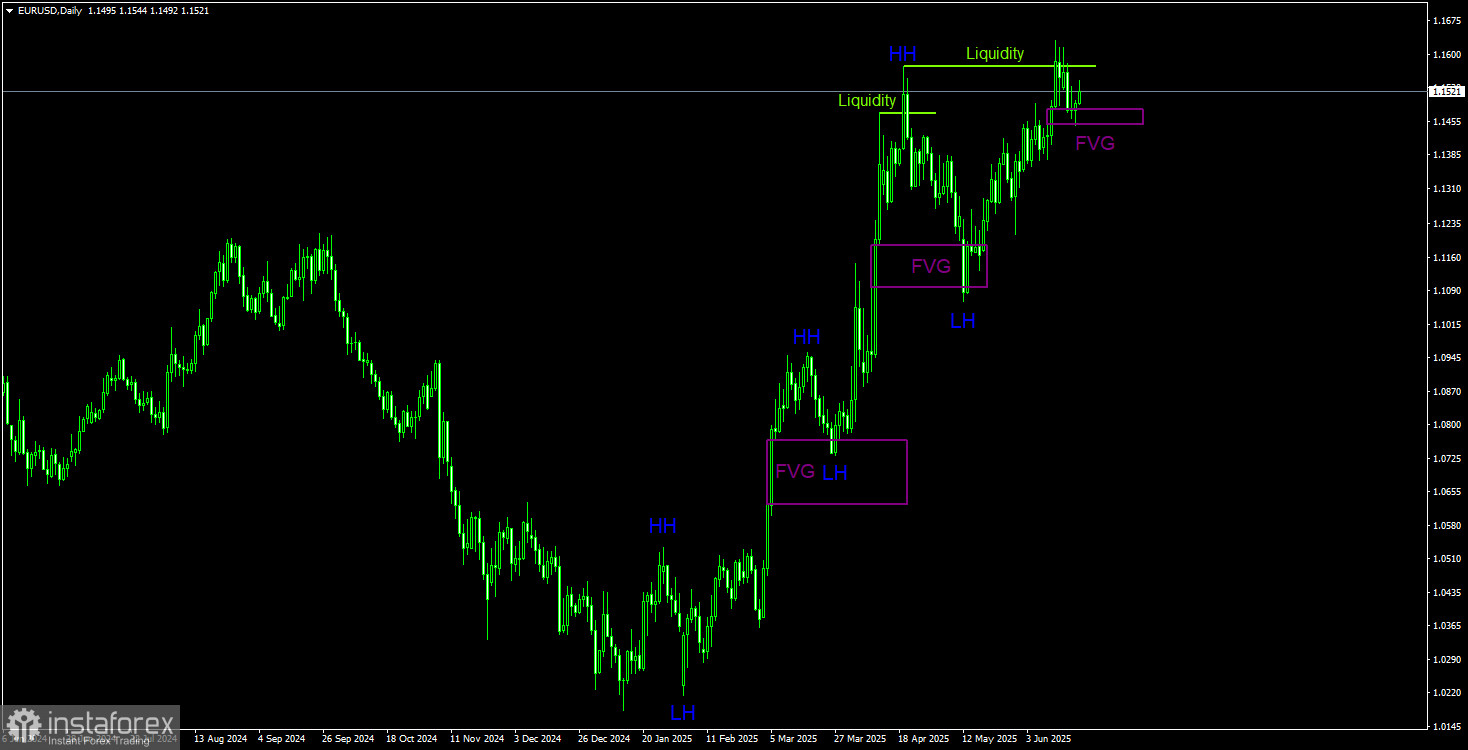
In the long term, we see a clear upward trend. Of course, every bullish trend ends eventually, but the only sign of a possible decline is a liquidity grab from the last higher high (HH). A bullish Fair Value Gap (FVG) zone is a potential bullish signal. A rebound from this area indicates a resumption of euro growth. The upward trend structure remains valid as long as the price stays above 1.1100. Therefore, even if the dollar strengthens by a few hundred points, it won't break the trend. The overall fundamental backdrop still does not favor the U.S. dollar, although the current news flow is too powerful to be fully confident in any specific direction.
COT Report
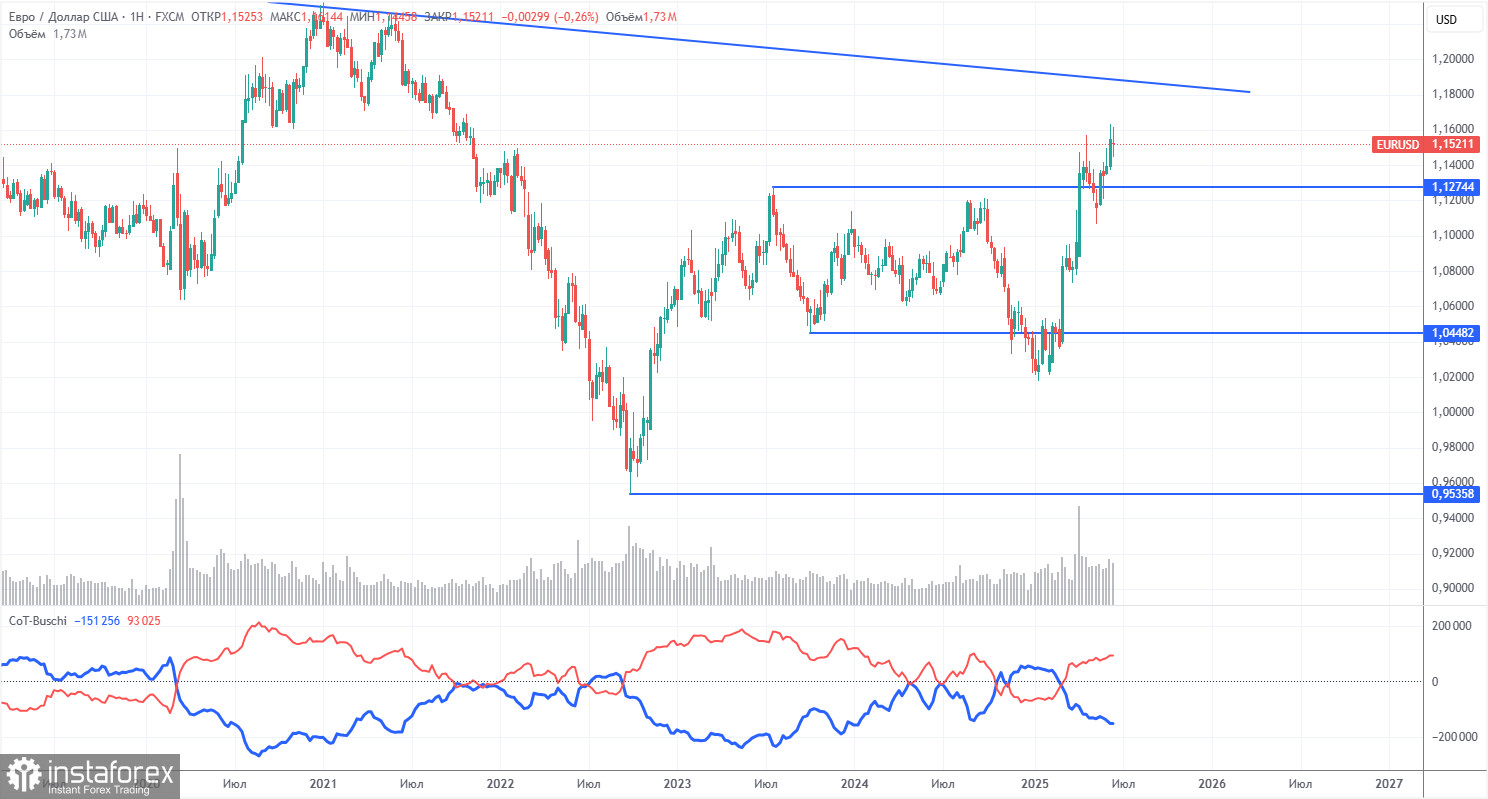
The most recent COT report is dated June 10. The chart above shows that the net position of non-commercial traders has long been bullish. Bears gained the upper hand briefly at the end of 2024 but quickly lost it. Since Trump assumed the presidency, only the dollar has been falling. We cannot say with 100% certainty that the dollar will continue to fall, but current global events suggest this scenario is likely.
We still see no fundamental reasons for the euro to strengthen. However, there is a powerful fundamental reason for the dollar to decline. The global downtrend remains intact—but what relevance does the past 16 years of price action have now? Once Trump ends his trade wars, the dollar could begin to rise. But will Trump ever end them? And when?
The red and blue lines have crossed again, signaling a renewed bullish trend. During the latest reporting week, the number of longs held by the "Non-commercial" group increased by 6,000, and the number of shorts decreased by 4,300. As a result, the net position rose by 10,300 over the week.
EUR/USD 1-Hour Analysis
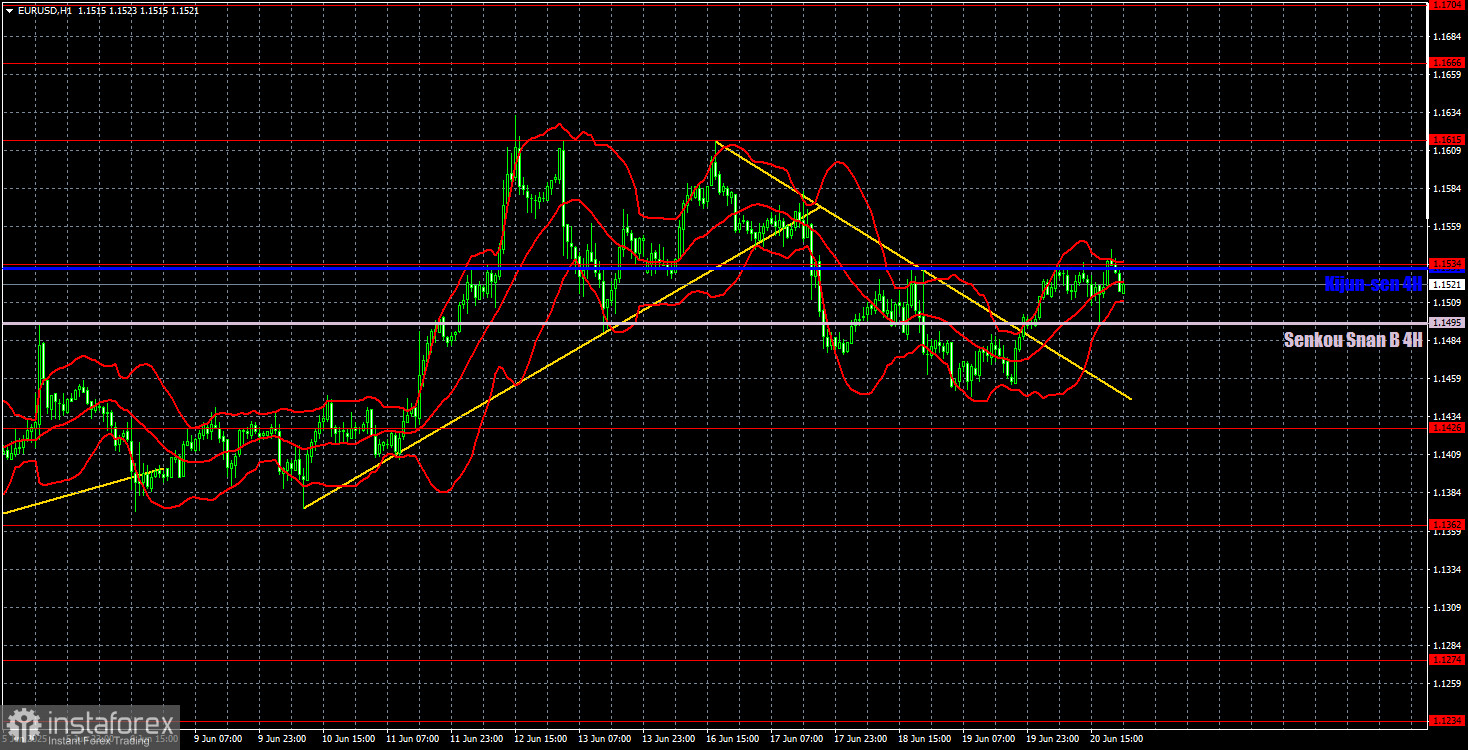
In the hourly time frame, the EUR/USD pair both started and ended a local bearish trend. On the daily TF, the pair rebounded from the FVG zone, so a resumption of the upward movement is quite likely. However, the U.S.'s official entry into war with Iran could backfire for the dollar—or support it. The market may interpret the event in various ways. Technically, the probability of growth remains higher. Fundamentally, the dollar may still show strength this week.
For June 23, we highlight the following levels for trading - 1.1092, 1.1147, 1.1185, 1.1234, 1.1274, 1.1362, 1.1426, 1.1534, 1.1615, 1.1666, 1.1704, 1.1750, as well as the Senkou Span B (1.1495) and Kijun-sen (1.1534) lines. Ichimoku lines may shift during the day, so factor this in when evaluating signals. Remember to move the Stop Loss to breakeven once the price moves 15 pips in the right direction—this will help protect against potential losses from false signals.
On Monday, business activity indices for the services and manufacturing sectors for June will be released in the Eurozone, Germany, and the U.S. However, we have a feeling that these reports may not be the primary drivers of market dynamics at the start of the week.
Illustration Explanations:
- Support and resistance price levels – thick red lines where movement may end. They are not trading signal sources.
- Kijun-sen and Senkou Span B lines—These are strong Ichimoku indicator lines transferred to the hourly timeframe from the 4-hour one.
- Extremum levels – thin red lines where the price has previously rebounded. These act as trading signal sources.
- Yellow lines – trend lines, trend channels, and other technical patterns.
- COT Indicator 1 on the charts – the size of the net position for each category of traders.