empty
09.07.2025 08:28 AM
How to Trade the EUR/USD Currency Pair on July 9th? Simple Tips and Trade Breakdown for Beginners

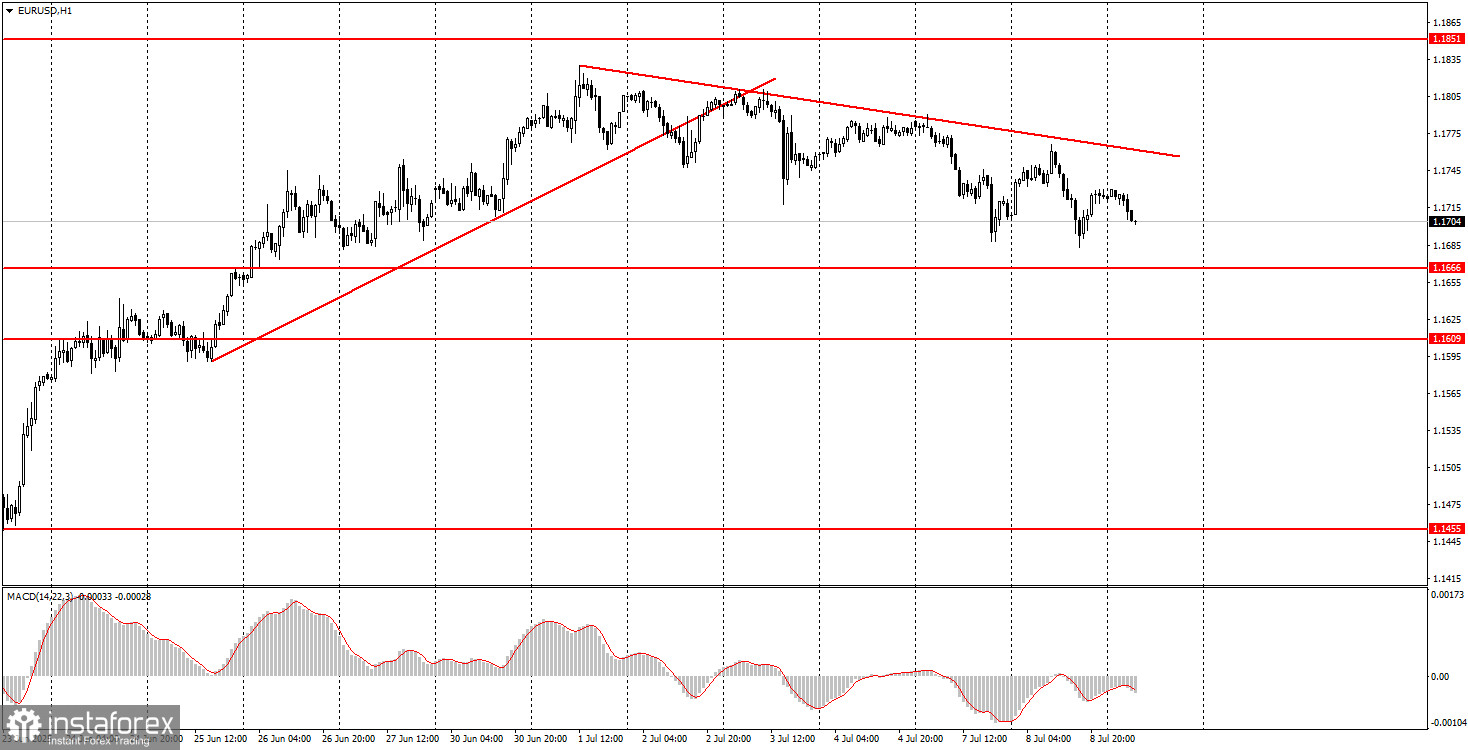
Tuesday Trade Breakdown: 1H Chart for EUR/USD

This image is no longer relevant

On Tuesday, the EUR/USD currency pair continued its mild downward movement in line with the prevailing trend. After a fairly strong upward move, the market began a correction. The nature of the current decline fully aligns with the characteristics of a technical correction. Under these conditions, we expect a moderate technical strengthening of the U.S. dollar, after which the upward trend is likely to resume. At the moment, a downward trendline has formed, which can help beginner traders identify the end of the downward correction. It's also worth noting that last week the dollar had valid reasons to rise, but the market ignored them. This week, by contrast, there are several factors weighing on the dollar, yet it is rising—leading us to conclude that the current movement is technical in nature. Recall that this week Donald Trump already raised tariffs for a number of countries, while there has been virtually no macroeconomic backdrop in the first three trading days of the week.

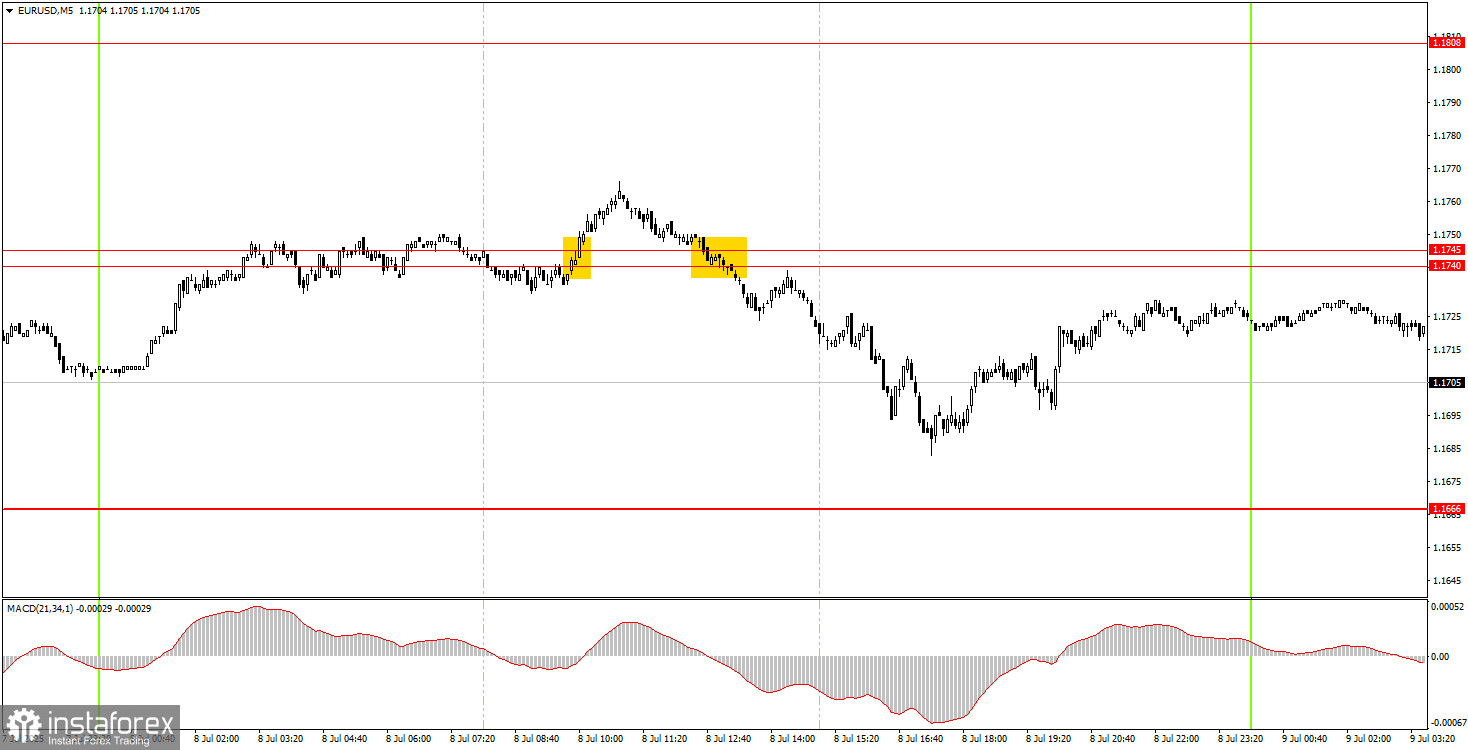
5M Chart for EUR/USD

This image is no longer relevant

On the 5-minute timeframe, two trade signals were generated on Tuesday. The pair first broke above the 1.1740–1.1745 level, but this buy signal turned out to be false. Unfortunately, the price failed to move even 15 points in the expected direction. The following sell signal, however, was valid, and the price declined by nearly 50 points after it was formed. Beginners could have easily captured 20–30 points from this trade. The position could have been closed at any point.

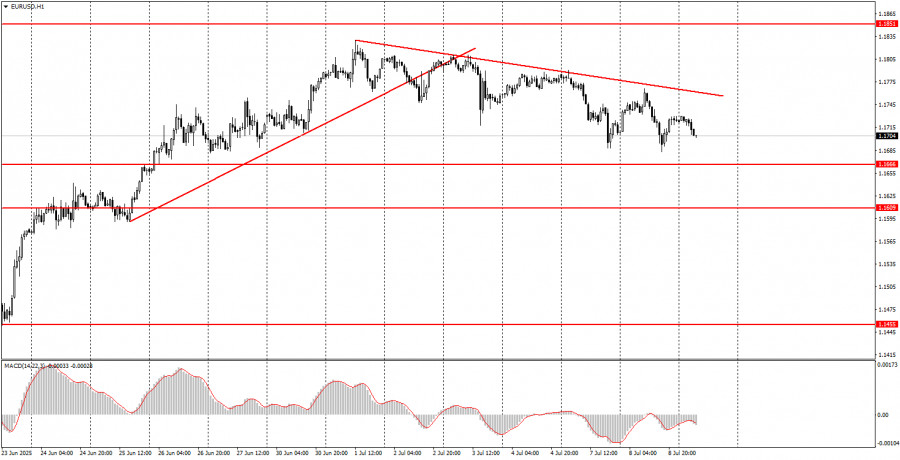
Trading on Wednesday:

On the hourly timeframe, the EUR/USD pair began a correction, but the five-month uptrend remains intact. The fact that Donald Trump is President of the United States is still a sufficient reason for the dollar to weaken regularly. Of course, the dollar will go through occasional corrections—as we are seeing now—but given the current fundamental backdrop, there is still little reason to expect strong gains from the U.S. currency. This week, the price may decline sluggishly, but breaking above the downward trendline would signal a new upward movement.

On Wednesday, the EUR/USD pair may continue its slow and gradual decline. No major events are scheduled for the third trading day of the week, so the technical correction may continue.

On the 5-minute chart, the relevant levels to watch are: 1.1198–1.1218, 1.1267–1.1292, 1.1354–1.1363, 1.1413, 1.1455–1.1474, 1.1527, 1.1561–1.1571, 1.1609, 1.1666, 1.1740–1.1745, 1.1808, 1.1851, 1.1908.

No macroeconomic publications or speeches are scheduled in the EU or the U.S. for Wednesday. Donald Trump has announced new tariffs for several countries on his list, but the market has not yet reacted to this escalation of the trade war.

Basic Trading System Rules:

  1. Signal strength is based on how long it takes for the signal to form (bounce or breakout from a level). The quicker it forms, the stronger the signal.
  2. If two or more false signals occur around the same level, all subsequent signals from that level should be ignored.
  3. During flat (sideways) markets, a pair may generate many false signals or none at all. It is best to stop trading at the first signs of a range-bound market.
  4. Trades should be opened during the time window from the start of the European session until the middle of the U.S. session. All trades should be manually closed after that.
  5. On the hourly timeframe, MACD indicator signals should be traded only if there is strong volatility and a trend confirmed by a trendline or trend channel.
  6. If two levels are too close together (5 to 20 points), treat them as a support or resistance zone.
  7. After a trade moves 15 points in the correct direction, move the Stop Loss to breakeven.

Chart Notes:

  • Support and Resistance Levels – These are price targets for buying or selling. Take Profit levels can be placed near them.
  • Red Lines – Trend channels or trendlines indicating the current market direction and preferred trading bias.
  • MACD Indicator (14, 22, 3) – Histogram and signal line used as an additional source of trade signals.
  • Major Speeches and Reports (always listed in the news calendar) can strongly affect the pair's movement. Trade with caution or exit the market during these events to avoid sharp reversals against the previous trend.

A reminder for beginner traders: not every trade will be profitable. Developing a clear strategy and practicing proper money management are key to long-term success in forex trading.

Paolo Greco,
Analytical expert of InstaForex
© 2007-2025
Summary
Urgency
Analytic
Stanislav Polyanskiy
Start trade
Earn on cryptocurrency rate changes with InstaForex
Download MetaTrader 4 and open your first trade
  • Grand Choice
    Contest by
    InstaForex
    InstaForex always strives to help you
    fulfill your biggest dreams.
    JOIN CONTEST

Recommended Stories

How to Trade the GBP/USD Pair on July 22? Simple Tips and Trade Analysis for Beginners

Analysis of Monday's Trades 1H Chart of GBP/USD On Monday, the GBP/USD pair exhibited movements nearly identical to those of the EUR/USD pair. This suggests that the US dollar

Paolo Greco 06:39 2025-07-22 UTC+2

How to Trade the EUR/USD Pair on July 22? Simple Tips and Trade Analysis for Beginners

Analysis of Monday's Trades 1H Chart of EUR/USD On Monday, the EUR/USD currency pair is likely to have completed a three-week downward trend. As a reminder, over the past

Paolo Greco 06:39 2025-07-22 UTC+2

Trading Recommendations and Trade Breakdown for GBP/USD on July 22: The Pound Begins to Reverse the Trend

The GBP/USD currency pair also maintained an upward trajectory throughout Monday. The reasons were identical to those for EUR/USD. The dollar had been rising for three weeks on pure trader

Paolo Greco 03:45 2025-07-22 UTC+2

Trading Recommendations and Trade Breakdown for EUR/USD on July 22: The Dollar's Fairytale Is Over

On Monday, the EUR/USD currency pair continued its upward movement, which began last week. There were no local macroeconomic reasons for the euro's rise, but there were plenty of fundamental

Paolo Greco 03:45 2025-07-22 UTC+2

GBP/USD: Trading Plan for the European Session on July 21. Commitment of Traders (COT) Reports (Analysis of Yesterday's Trades). Pound Attempted to Recover

Last Friday, only one entry point into the market was formed. Let's look at the 5-minute chart and analyze what happened. In my morning forecast, I highlighted the 1.3442 level

Miroslaw Bawulski 08:12 2025-07-21 UTC+2

EUR/USD: Trading Plan for the European Session on July 21. Commitment of Traders (COT) Reports (Analysis of Yesterday's Trades). Euro Correction Is Nearing Its End

Only one market entry point was formed last Friday. Let's look at the 5-minute chart to see what happened. In my morning forecast, I highlighted the 1.1654 level

Miroslaw Bawulski 08:11 2025-07-21 UTC+2

How to Trade the GBP/USD Pair on July 21? Simple Tips and Trade Analysis for Beginners

Analysis of Friday's Trades 1H Chart of GBP/USD The GBP/USD pair also traded higher on Friday, but this movement had little meaningful impact. The downtrend in the British pound remains

Paolo Greco 04:01 2025-07-21 UTC+2

How to Trade the EUR/USD Pair on July 21? Simple Tips and Trade Analysis for Beginners

Analysis of Friday's Trades 1H Chart of EUR/USD On Friday, the EUR/USD currency pair continued its upward movement after rebounding twice from the 1.1563 level

Paolo Greco 04:01 2025-07-21 UTC+2

How to Trade the GBP/USD Pair on July 18? Simple Tips and Trade Analysis for Beginners

Analysis of Thursday's Trades 1H Chart of GBP/USD On Thursday, the GBP/USD pair also traded with minimal volatility. Strangely enough, there was quite a lot of interesting data released yesterday

Paolo Greco 06:13 2025-07-18 UTC+2

How to Trade the EUR/USD Pair on July 18? Simple Tips and Trade Analysis for Beginners

Analysis of Thursday's Trades 1H Chart of EUR/USD On Thursday, the EUR/USD currency pair traded in a near-flat range with very low volatility (around 50 pips). After the storm

Paolo Greco 06:13 2025-07-18 UTC+2
Can't speak right now?
Ask your question in the chat.
Widget callback
 

Dear visitor,

Your IP address shows that you are currently located in the USA. If you are a resident of the United States, you are prohibited from using the services of InstaFintech Group including online trading, online transfers, deposit/withdrawal of funds, etc.

If you think you are seeing this message by mistake and your location is not the US, kindly proceed to the website. Otherwise, you must leave the website in order to comply with government restrictions.

Why does your IP address show your location as the USA?

  • - you are using a VPN provided by a hosting company based in the United States;
  • - your IP does not have proper WHOIS records;
  • - an error occurred in the WHOIS geolocation database.

Please confirm whether you are a US resident or not by clicking the relevant button below. If you choose the wrong option, being a US resident, you will not be able to open an account with InstaForex anyway.

We are sorry for any inconvenience caused by this message.