empty
25.07.2025 12:39 PM
EUR/USD. July 25th. The ECB Monitors EU–US Trade Negotiations

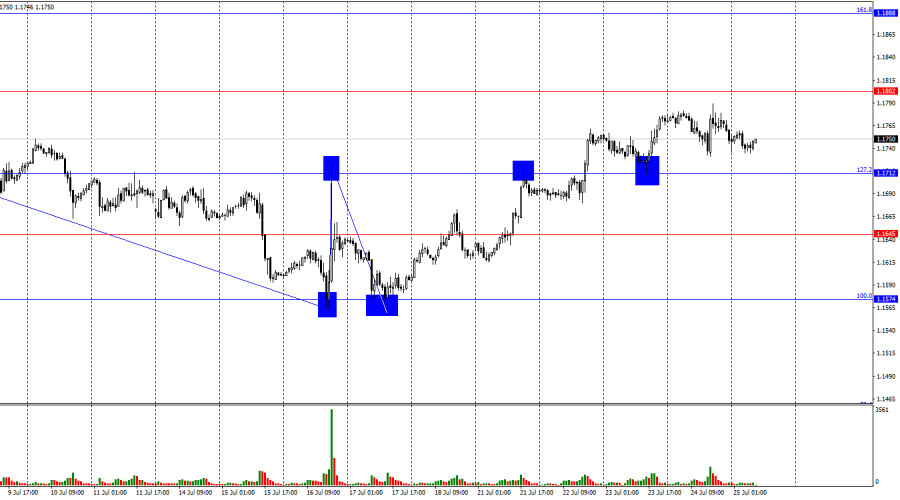
On Thursday, the EUR/USD pair traded sideways. The outcome of the ECB meeting had virtually no impact on market sentiment—and the meeting itself turned out to be uneventful. As a result, the EUR/USD pair continues to trade within the range of 1.1712 to 1.1802, without breaking through either level. Today, a rebound from either of these levels would signal a move in the opposite direction toward the other boundary of the range.

This image is no longer relevant

The wave pattern on the hourly chart remains straightforward and clear. The last completed downward wave failed to break the previous low, while the most recent upward wave surpassed the prior high. Therefore, despite the extended correction, the current trend remains bullish. The lack of real progress in the U.S. trade negotiations, the low likelihood of concluding trade agreements with most countries, and the imposition of new tariffs continue to weigh heavily on bearish prospects.

On Thursday, the ECB held its fifth policy meeting of the year but made no changes to its monetary policy. As a reminder, the ECB had cut interest rates at each of its four previous meetings this year. However, inflation in the eurozone has slowed into the desired range, and the ECB remains highly concerned about the outcome of trade negotiations between the U.S. and the EU. If a deal cannot be reached, Donald Trump is expected to impose higher tariffs, prompting the EU to respond in kind, potentially driving up inflation. For this reason, continuing to ease policy without an agreement is risky. At the same time, any tariffs would weigh on the already sluggish European economy. If a deal is reached, the economy may feel some relief, and inflation may remain at its current levels. In that case, the ECB may consider further easing. As such, future policy decisions will depend on the outcome of talks between Washington and Brussels.
This image is no longer relevant

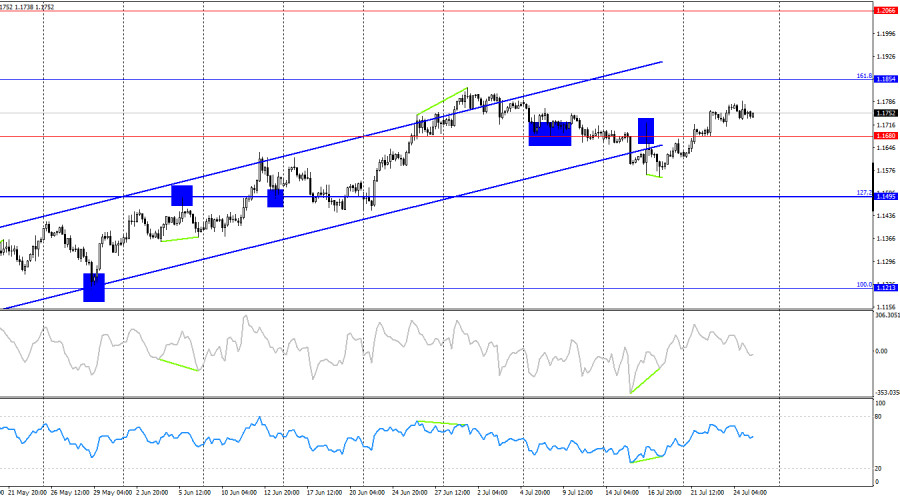
On the 4-hour chart, the pair reversed in favor of the euro and consolidated above the 1.1680 level. Previously, the euro had closed below the ascending trend channel. I still refrain from concluding that a bearish trend has begun. In my view, the hourly chart is currently more informative. The pair exited the trend channel not due to strong bearish pressure but due to a prolonged correction. The upward movement may continue toward the 161.8% Fibonacci level at 1.1854.

Commitments of Traders (COT) Report:

This image is no longer relevant

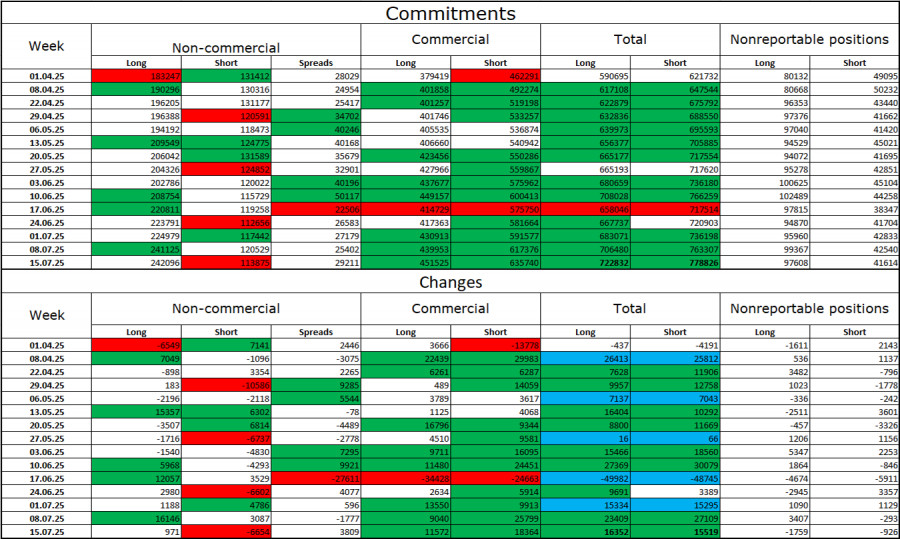
During the most recent reporting week, professional traders opened 971 new long positions and closed 6,654 short positions. Sentiment among the "Non-commercial" category remains bullish, largely thanks to Donald Trump, and continues to strengthen. Speculators now hold a total of 242,000 long positions and just 113,000 short contracts—a more than twofold gap. Also noteworthy is the number of green cells in the table above, indicating strong accumulation of euro positions. In most cases, interest in the euro continues to grow, meaning sentiment toward the dollar is weakening.

For 23 consecutive weeks, large traders have been reducing short positions while increasing longs. The divergence in monetary policy between the ECB and the Fed remains significant, but Donald Trump's policies are viewed as a more influential factor, as they could trigger a recession in the U.S. economy and a host of other structural, long-term problems for America.

News Calendar for the U.S. and the Eurozone:

  • Eurozone – Germany Business Climate Index (08:00 UTC)
  • United States – Durable Goods Orders Change (12:30 UTC)

The economic calendar for July 25 includes two entries. The overall influence of the news background on market sentiment this Friday may be limited.

EUR/USD Forecast and Trading Tips:

Selling the pair today is possible in case of a rebound from the 1.1802 level on the hourly chart, targeting 1.1712—or in the event of a break below 1.1712, targeting 1.1645. Buying opportunities were available on a rebound from 1.1574, a close above 1.1645, or a close above 1.1712 with a target of 1.1802. Today, long positions can still be held with targets of 1.1802 and 1.1888 until a sell signal emerges. I recommend moving Stop Loss orders closer to current price levels.

Fibonacci grids are drawn from 1.1574 to 1.1066 on the hourly chart and from 1.1214 to 1.0179 on the 4-hour chart.

Samir Klishi,
Analytical expert of InstaForex
© 2007-2025
Summary
Urgency
Analytic
Grigory Sokolov
Start trade
Earn on cryptocurrency rate changes with InstaForex
Download MetaTrader 4 and open your first trade
  • Grand Choice
    Contest by
    InstaForex
    InstaForex always strives to help you
    fulfill your biggest dreams.
    JOIN CONTEST

Recommended Stories

Forecast for GBP/USD on August 11, 2025

On the hourly chart, GBP/USD on Friday made two rebounds from the 1.3425 level, and on Monday continues moving upward toward the 76.4% retracement level at 1.3470. A rebound from

Samir Klishi 10:25 2025-08-11 UTC+2

Forex forecast 11/08/2025: EUR/USD, USD/JPY, GBP/USD, Gold, Ethereum and Bitcoin

Useful links: My other articles are available in this section InstaForex course for beginners Popular Analytics Open trading account Important: The begginers in forex trading need to be very careful

Sebastian Seliga 10:20 2025-08-11 UTC+2

GBP/USD. Technical Analysis for the Week of August 11–16

Trend Analysis This week, from the 1.3450 level (close to the last weekly candle), the price may start moving downward toward 1.3270 – a historical support level (blue dotted line)

Stefan Doll 10:02 2025-08-11 UTC+2

EUR/USD. Technical Analysis for the Week of August 11–16

Last week, the pair moved upward, almost testing the historical resistance level at 1.1710 (blue dotted line), and then turned downward, closing the weekly candle at 1.1641. In the coming

Stefan Doll 09:55 2025-08-11 UTC+2

GBP/USD. Indicator Analysis on August 11, 2025

On Friday, the pair moved downward, tested the 61.8% retracement level at 1.3416 (red dotted line), and then rose, closing the daily candle at 1.3450. Today, the price will attempt

Stefan Doll 09:53 2025-08-11 UTC+2

EUR/USD. Indicator Analysis on August 11, 2025

On Friday, the pair moved downward, almost testing the 23.6% retracement level at 1.1626 (blue dotted line), after which the price rose slightly and closed the daily candle at 1.1641

Stefan Doll 09:40 2025-08-11 UTC+2

If the USD/JPY successfully breaks through the Pivot level, it has the potential to continue strengthening. Monday, August 11, 2025.

[USD/JPY] – [Monday, August 11, 2025] Although the condition of USD/JPY is still moving sideways, as indicated by the overlapping EMAs, the USD/JPY's successful breakout and close above its Pivot

Arief Makmur 07:37 2025-08-11 UTC+2

NZD/USD still has the opportunity to continue strengthening to its nearest resistance level. Monday, August 11, 2025.

[NZD/USD] – [Monday, August 11, 2025] With both EMAs forming a Golden Cross and the RSI(14) indicator at the Neutral Bullish level, the Kiwi has the potential to strengthen today

Arief Makmur 07:37 2025-08-11 UTC+2

EUR/USD Forecast for August 11, 2025

The euro has settled even more firmly at the 1.1632 support level. The longer it consolidates there, the more balanced the probabilities of growth and decline will become. However

Laurie Bailey 05:01 2025-08-11 UTC+2

GBP/USD Forecast for August 11, 2025

The British pound is consolidating at its recently reached height, at the intermediate short-term growth level of 1.3452. A firm break above this level will open the way to another

Laurie Bailey 05:01 2025-08-11 UTC+2
Can't speak right now?
Ask your question in the chat.
Widget callback
 

Dear visitor,

Your IP address shows that you are currently located in the USA. If you are a resident of the United States, you are prohibited from using the services of InstaFintech Group including online trading, online transfers, deposit/withdrawal of funds, etc.

If you think you are seeing this message by mistake and your location is not the US, kindly proceed to the website. Otherwise, you must leave the website in order to comply with government restrictions.

Why does your IP address show your location as the USA?

  • - you are using a VPN provided by a hosting company based in the United States;
  • - your IP does not have proper WHOIS records;
  • - an error occurred in the WHOIS geolocation database.

Please confirm whether you are a US resident or not by clicking the relevant button below. If you choose the wrong option, being a US resident, you will not be able to open an account with InstaForex anyway.

We are sorry for any inconvenience caused by this message.