signal strength 3 of 5
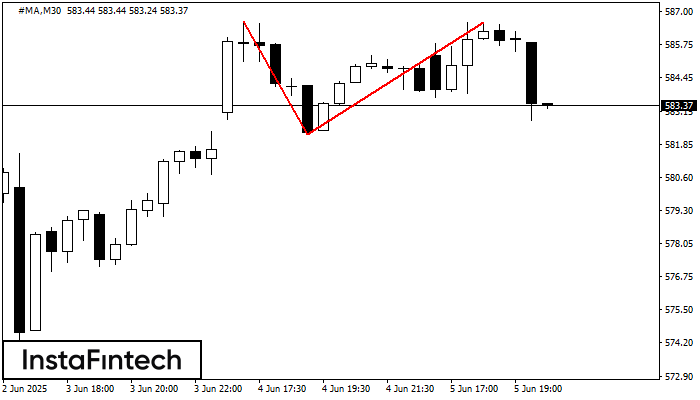
On the chart of #MA M30 the Double Top reversal pattern has been formed. Characteristics: the upper boundary 586.60; the lower boundary 582.27; the width of the pattern 433 points. The signal: a break of the lower boundary will cause continuation of the downward trend targeting the 581.97 level.
- All
- Double Top
- Flag
- Head and Shoulders
- Pennant
- Rectangle
- Triangle
- Triple top
- All
- #AAPL
- #AMZN
- #Bitcoin
- #EBAY
- #FB
- #GOOG
- #INTC
- #KO
- #MA
- #MCD
- #MSFT
- #NTDOY
- #PEP
- #TSLA
- #TWTR
- AUDCAD
- AUDCHF
- AUDJPY
- AUDUSD
- EURCAD
- EURCHF
- EURGBP
- EURJPY
- EURNZD
- EURRUB
- EURUSD
- GBPAUD
- GBPCHF
- GBPJPY
- GBPUSD
- GOLD
- NZDCAD
- NZDCHF
- NZDJPY
- NZDUSD
- SILVER
- USDCAD
- USDCHF
- USDJPY
- USDRUB
- All
- M5
- M15
- M30
- H1
- D1
- All
- Buy
- Sale
- All
- 1
- 2
- 3
- 4
- 5
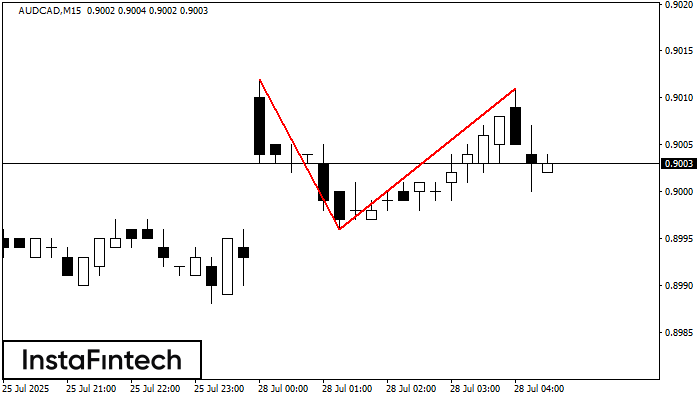
The Double Top pattern has been formed on AUDCAD M15. It signals that the trend has been changed from upwards to downwards. Probably, if the base of the pattern 0.8996
The M5 and M15 time frames may have more false entry points.
Открыть график инструмента в новом окне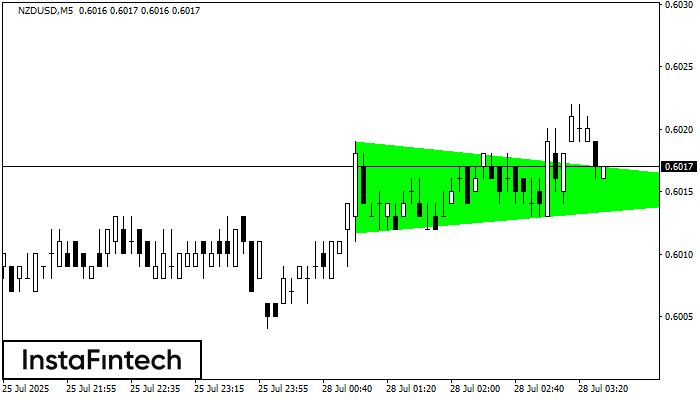
According to the chart of M5, NZDUSD formed the Bullish Symmetrical Triangle pattern. Description: This is the pattern of a trend continuation. 0.6019 and 0.6012 are the coordinates
The M5 and M15 time frames may have more false entry points.
Открыть график инструмента в новом окне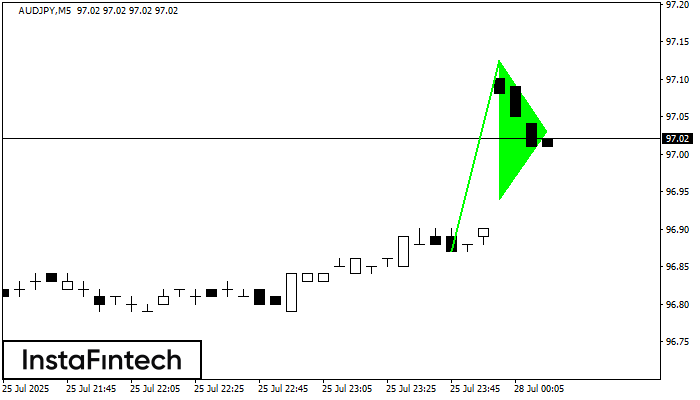
The Bullish pennant signal – Trading instrument AUDJPY M5, continuation pattern. Forecast: it is possible to set up a buy position above the pattern’s high of 97.13, with the prospect
The M5 and M15 time frames may have more false entry points.
Открыть график инструмента в новом окне