signal strength 1 of 5
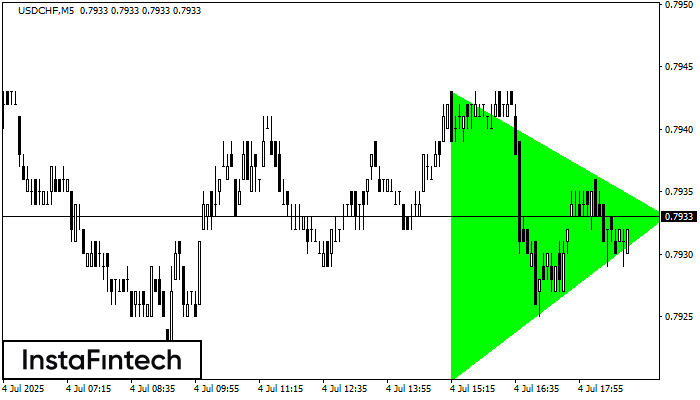
According to the chart of M5, USDCHF formed the Bullish Symmetrical Triangle pattern. Description: This is the pattern of a trend continuation. 0.7943 and 0.7920 are the coordinates of the upper and lower borders respectively. The pattern width is measured on the chart at 23 pips. Outlook: If the upper border 0.7943 is broken, the price is likely to continue its move by 0.7948.
The M5 and M15 time frames may have more false entry points.
- All
- Double Top
- Flag
- Head and Shoulders
- Pennant
- Rectangle
- Triangle
- Triple top
- All
- #AAPL
- #AMZN
- #Bitcoin
- #EBAY
- #FB
- #GOOG
- #INTC
- #KO
- #MA
- #MCD
- #MSFT
- #NTDOY
- #PEP
- #TSLA
- #TWTR
- AUDCAD
- AUDCHF
- AUDJPY
- AUDUSD
- EURCAD
- EURCHF
- EURGBP
- EURJPY
- EURNZD
- EURRUB
- EURUSD
- GBPAUD
- GBPCHF
- GBPJPY
- GBPUSD
- GOLD
- NZDCAD
- NZDCHF
- NZDJPY
- NZDUSD
- SILVER
- USDCAD
- USDCHF
- USDJPY
- USDRUB
- All
- M5
- M15
- M30
- H1
- D1
- All
- Buy
- Sale
- All
- 1
- 2
- 3
- 4
- 5
was formed on 14.08 at 04:50:21 (UTC+0)
signal strength 1 of 5
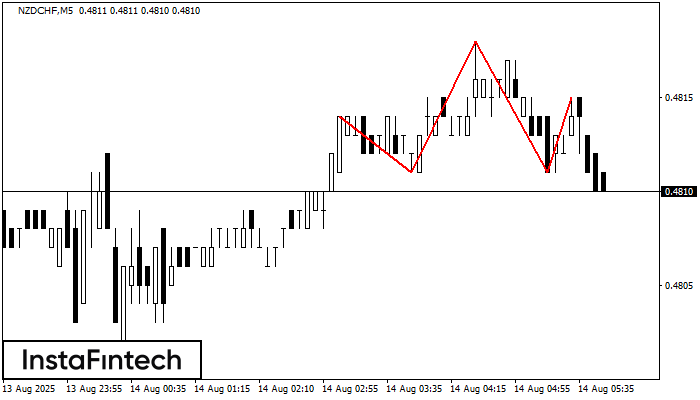
อ้างอิงจากชาร์ตของ M5, NZDCHF ที่ได้สร้างรูปแบบ รูปแบบกราฟหัวและหัวไหล่ (Head and Shoulders) ออกมา สำหรับระดับสูงสุดของตำแหน่งหัวอยู่ใน 0.4818 ขณะที่เส้นระดับกลางของตำแหน่งคอจะอยู่ใน 0.4811/0.4811 การก่อตัวของรูปแบบ รูปแบบกราฟหัวและหัวไหล่
ขอบเตระยะเวลาใน M5 และ M15 อาจจะมีตำแหน่งการเข้าใช้งานที่ผิดพลาดมากยิ่งขึ้น
Open chart in a new windowwas formed on 14.08 at 04:45:04 (UTC+0)
signal strength 1 of 5
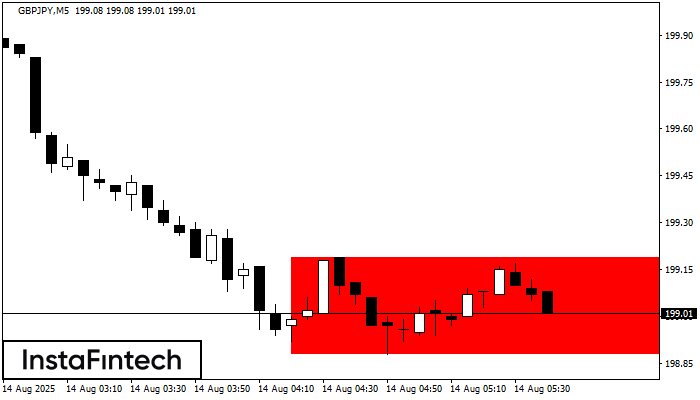
อ้างอิงจากชาร์ตของ M5, GBPJPY ที่ได้สร้างรูปแบบ รูปแบบกราฟสี่เหลี่ยมผืนผ้าขาลง (Bearish Rectangle) ออกมา รูปแบบประเภทนี้แสดงถึง ความต่อเนื่องในแนวโน้ม มันประกอบไปด้วยสองระดับ: แนวต้าน 199.19 - 0.00
ขอบเตระยะเวลาใน M5 และ M15 อาจจะมีตำแหน่งการเข้าใช้งานที่ผิดพลาดมากยิ่งขึ้น
Open chart in a new window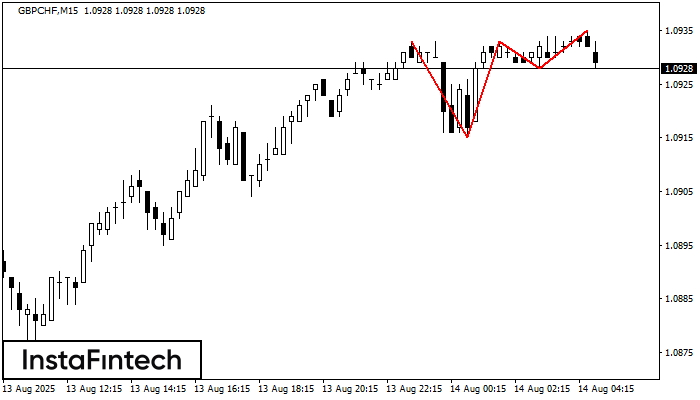
รูปแบบ รูปแบบกราฟจุดสามยอด (Triple Top) ได้สร้างขึ้นมาในชาร์ตของ GBPCHF M15 คุณลักษณะของกราฟรูปแบบนี้: ขอบเขตมีมุมหงายขึ้น; เส้นด้านล่างของกราฟรูปแบบนี้มีพิกัดอยู่ที่ 1.0915/1.0928 พร้อมกับลิมิตขาขึ้น 1.0933/1.0935; ระยะของความกว้างคือ
ขอบเตระยะเวลาใน M5 และ M15 อาจจะมีตำแหน่งการเข้าใช้งานที่ผิดพลาดมากยิ่งขึ้น
Open chart in a new window