empty
14.07.2025 11:31 AM
Forecast for EUR/USD on July 14, 2025

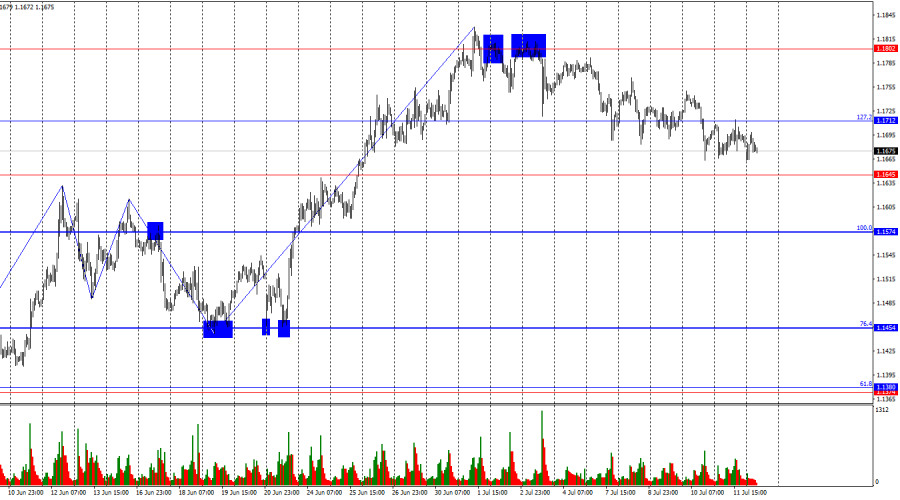
On Friday, the EUR/USD pair rebounded from the 127.2% Fibonacci retracement level at 1.1712, reversed in favor of the U.S. dollar, and resumed its decline toward the 1.1645 level. A rebound from this level would support a reversal in favor of the euro and a moderate rise toward 1.1712. A close below 1.1645 would increase the likelihood of a further decline toward the next retracement level of 100.0% at 1.1574. Let me remind you that I do not consider the 1.1712 level for trading signals.

This image is no longer relevant

The wave pattern on the hourly chart remains simple and clear. The most recent completed upward wave broke above the previous peak, while the new downward wave hasn't come close to the previous low. Thus, the trend remains bullish. The lack of real progress in U.S. trade negotiations, the low likelihood of trade agreements with most countries, and the new round of tariff hikes continue to cast a shadow on bearish prospects.

There was no significant news from the EU or the U.S. on Friday, but last week Donald Trump announced a large batch of new import tariffs. This week has started in a similar tone: Trump raised import tariffs on goods from the European Union to 30%. As in previous cases, the new tariffs will come into force on August 1. Trump's overall policy on this issue is crystal clear. He aims to secure trade deals that retain tariffs but are favorable to the U.S. To obtain these deals, he uses tariffs as a pressure tool against his opponents. The repeated delays in implementing tariff hikes give trade partners more time and push them to negotiate faster and with more flexibility. Therefore, it is still too early to talk about actual tariff increases — they will take effect only on August 1. Bulls understand this and are in no rush to reenter the market aggressively. Bears have room to act for now, but their attacks are weak and lack momentum.

This image is no longer relevant

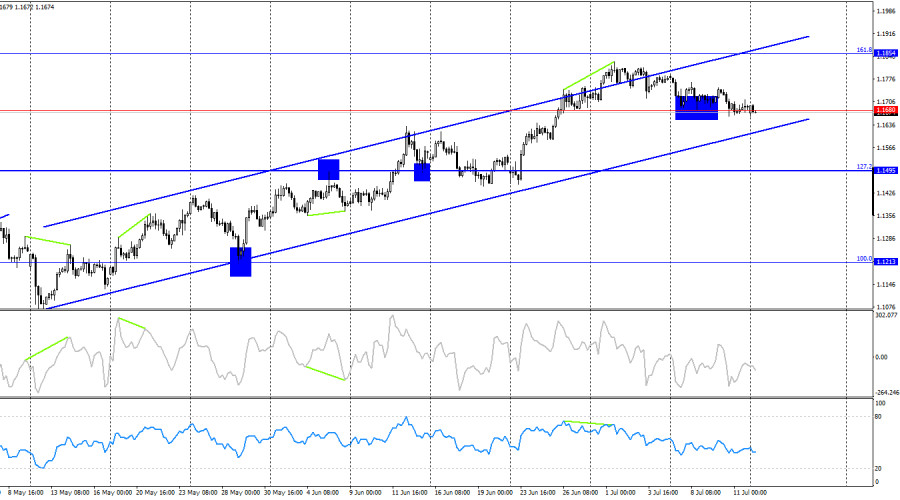
On the 4-hour chart, the pair has returned to the 1.1680 level. A rebound from this level would support the euro and a resumption of upward movement toward the next Fibonacci retracement level of 161.8% at 1.1851. A close below this level would open the path toward the lower boundary of the ascending trend channel. There are currently no signs of divergence on any indicators.

Commitments of Traders (COT) Report:

This image is no longer relevant

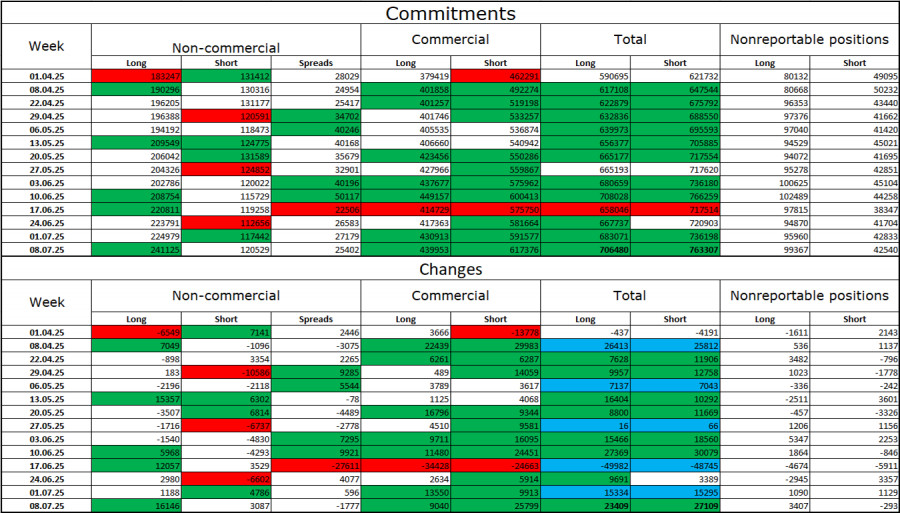
Over the latest reporting week, professional traders opened 1,188 new long positions and 4,786 short positions. The sentiment among the "Non-commercial" group remains bullish, thanks to Donald Trump, and has only strengthened over time. The total number of long positions held by speculators is now 225,000, while short positions stand at 117,000. The gap (with rare exceptions) continues to widen. Thus, the euro remains in demand, while the dollar does not. The situation remains unchanged.

For 22 consecutive weeks, large players have been reducing short positions and increasing longs. Despite a significant divergence in monetary policy between the ECB and the Fed, Trump's trade policies are a more influential factor for traders. His actions risk triggering a recession in the U.S. economy and other long-term structural problems for America.

News calendar for the U.S. and the EU:On July 14, the economic calendar contains no major entries. As such, the news backdrop will not influence market sentiment on Monday.

EUR/USD Forecast and Trader Recommendations:I would not consider selling the pair today, as recent price movements have been too weak and unstable. Buying is possible after a rebound from the 1.1645 level on the hourly chart with a target of 1.1712, as bulls still appear to have a significantly stronger position than bears.

Fibonacci levels were plotted from 1.1574 to 1.1066 on the hourly chart and from 1.1214 to 1.0179 on the 4-hour chart.

Samir Klishi,
Analytical expert of InstaForex
© 2007-2025
Summary
Urgency
Analytic
Grigory Sokolov
Start trade
Earn on cryptocurrency rate changes with InstaForex
Download MetaTrader 4 and open your first trade
  • Grand Choice
    Contest by
    InstaForex
    InstaForex always strives to help you
    fulfill your biggest dreams.
    JOIN CONTEST

Recommended Stories

Forecast for EUR/USD on September 23, 2025

EUR/USD The weakness the euro showed at the Kijun-sen (MACD) line (daily) quickly resulted in a sharp rebound back into the range of September 18, as rising yields on U.S

Laurie Bailey 05:58 2025-09-23 UTC+2

Forecast for GBP/USD on September 23, 2025

GBP/USD Yesterday's 0.39% drop in the U.S. dollar index hindered the continuation of the British pound's downward movement. The price returned to the Kijun-sen (MACD) line, and during today's Pacific

Laurie Bailey 05:51 2025-09-23 UTC+2

Forecast for USD/CAD on September 23, 2025

USD/CAD Yesterday was a significant day for the USD/CAD pair — the price broke through the resistance of the balance indicator line and the target level of 1.3810, accompanied

Laurie Bailey 05:44 2025-09-23 UTC+2

USD/JPY. Analysis and Forecast

Technically speaking, the price holding above the round-number level of 148.00 paves the way for continued growth in the USD/JPY currency pair. Additionally, daily chart oscillators remain in positive territory

Irina Yanina 21:45 2025-09-22 UTC+2

Forecast for EUR/USD on September 22, 2025

On Friday, the EUR/USD pair continued its decline after bouncing off the 1.1789–1.1802 zone. The decline in the euro may continue toward the 76.4% corrective level at 1.1695

Samir Klishi 11:45 2025-09-22 UTC+2

Forecast for GBP/USD on September 22, 2025

On the hourly chart, the GBP/USD pair continued its decline on Friday after consolidating below the 1.3587–1.3620 zone and ended the day with a close below the 76.4% Fibonacci level

Samir Klishi 11:36 2025-09-22 UTC+2

GBP/USD. Technical Analysis for the Week of September 22–27

Last week, the pair moved upward toward the Bollinger Band line at 1.3721 (black dashed line), and then the price turned downward, closing the weekly candle at 1.3466

Stefan Doll 11:24 2025-09-22 UTC+2

EUR/USD. Technical Analysis for the Week of September 22–27

Last week, the pair moved upward and tested the 161.8% target level at 1.1886 (red dashed line), after which the price moved down, closing the weekly candle at 1.1745

Stefan Doll 11:21 2025-09-22 UTC+2

GBP/USD Indicator Analysis on September 22, 2025

On Friday, the pair moved downward, breaking through the 61.8% retracement level at 1.3465 (blue dashed line), and closed the daily candle at 1.3462. Today, the price will attempt

Stefan Doll 11:14 2025-09-22 UTC+2

EUR/USD. Indicator Analysis on September 22, 2025

On Friday, the pair moved downward. The 13-period EMA – 1.1698 (yellow thin line) turned upward, closing the daily candle at 1.1745. Today, the pair will attempt to begin upward

Stefan Doll 11:10 2025-09-22 UTC+2
Can't speak right now?
Ask your question in the chat.
Widget callback
 

Dear visitor,

Your IP address shows that you are currently located in the USA. If you are a resident of the United States, you are prohibited from using the services of InstaFintech Group including online trading, online transfers, deposit/withdrawal of funds, etc.

If you think you are seeing this message by mistake and your location is not the US, kindly proceed to the website. Otherwise, you must leave the website in order to comply with government restrictions.

Why does your IP address show your location as the USA?

  • - you are using a VPN provided by a hosting company based in the United States;
  • - your IP does not have proper WHOIS records;
  • - an error occurred in the WHOIS geolocation database.

Please confirm whether you are a US resident or not by clicking the relevant button below. If you choose the wrong option, being a US resident, you will not be able to open an account with InstaForex anyway.

We are sorry for any inconvenience caused by this message.