GBP/USD
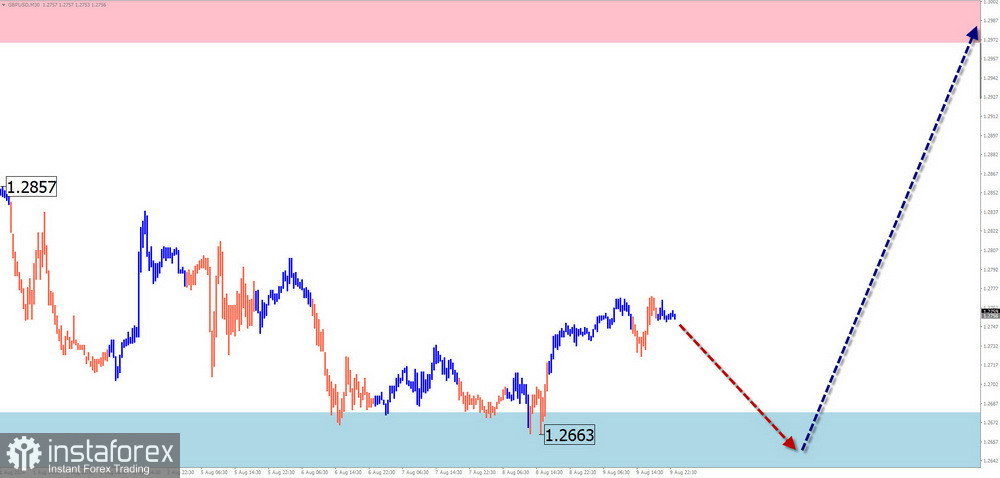
Analysis: Since autumn of last year, the direction of the British pound has been guided by a bullish trend. In the short term, the price has been declining throughout the last month. However, it is important to note that this wave is correcting the overall upward trend on the weekly chart. Since August 6, the quotes have been forming a counter-movement.
Forecast: In the upcoming week, the bearish sentiment is expected to fully conclude, leading to a change in direction and a resumption of price growth. A sharp increase in volatility and a brief breach of the support zone cannot be ruled out during the direction change. The calculated resistance shows the upper boundary of the expected weekly range for the pair.
Potential Reversal Zones:
- Resistance: 1.2970/1.3020
- Support: 1.2680/1.2630
Recommendations:
- Purchases: Can be profitable within intraday trading with a reduced volume size. Confirmation via trading signals is required before opening trades.
- Sales: There are no conditions for such trades this week.
AUD/USD
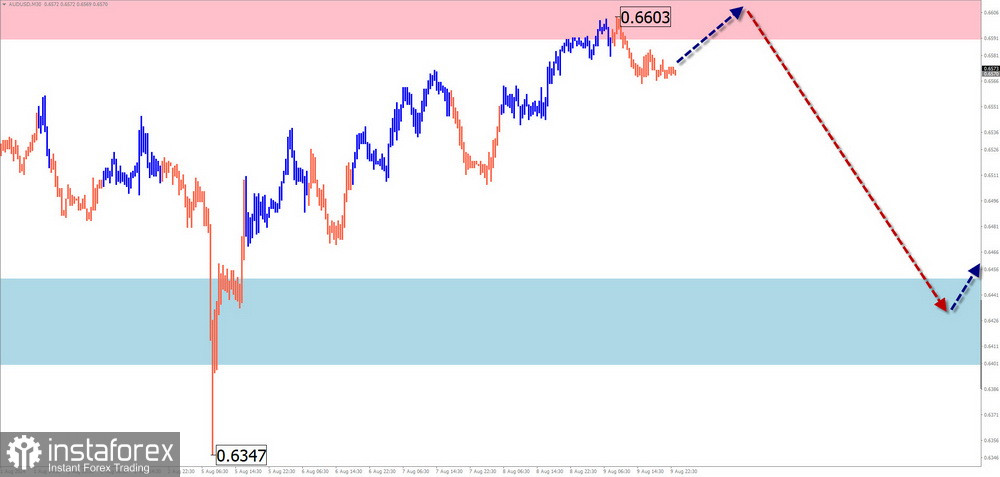
Analysis: The bearish trend on the AUD/USD chart continues. The unfinished wave segment started in mid-July. The price of the Australian dollar reversed on August 5 from strong daily support. The potential of the upward movement already exceeds the level of the previous bearish wave correction. A correction is now necessary within this structure, after which the price rise will continue.
Forecast: At the beginning of the upcoming week, a sideways movement along the lower boundary of the calculated resistance is expected. This will be followed by a change in direction and a resumption of the downward trend. The support zone shows the most likely lower boundary for the week's range.
Potential Reversal Zones:
- Resistance: 0.6590/0.6640
- Support: 0.6450/0.6400
Recommendations:
- Purchases: No conditions exist for such trades in the AUD market.
- Sales: Not relevant until confirmed signals appear near the resistance zone.
USD/CHF
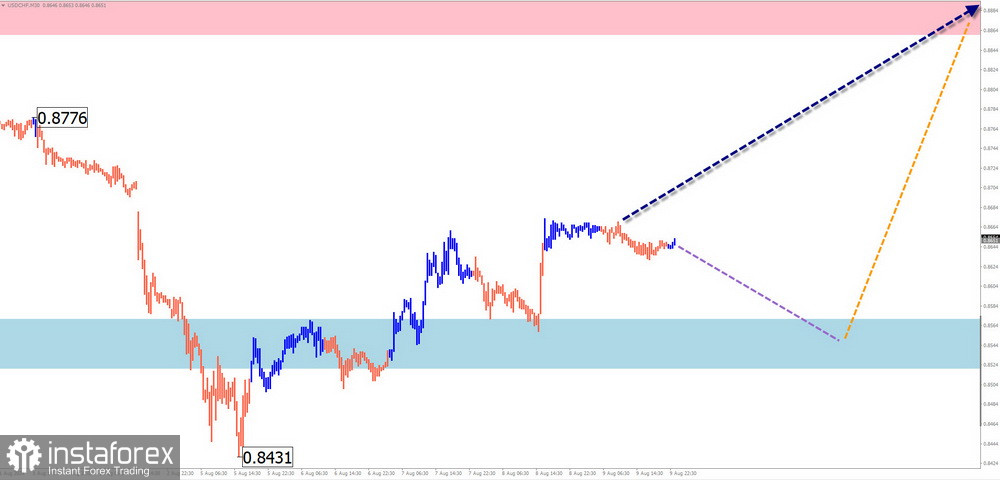
Analysis: The bearish wave that began in November last year is coming to an end on the USD/CHF chart. The price has reached the upper boundary of the preliminary target zone and has reversed direction. The wave level of the bullish wave that started on August 5 exceeds the level of the previous correction and has reversal potential.
Forecast: At the beginning of the upcoming week, a mostly horizontal movement with a downward vector is expected. Conditions for a reversal may form near the support zone. A change in direction and renewed price growth are likely by the end of the week.
Potential Reversal Zones:
- Resistance: 0.8860/0.8910
- Support: 0.8570/0.8520
Recommendations:
- Purchases: Initiating purchases would be premature without confirmed reversal signals near the support zone.
- Sales: Short-term trades with a fractional volume may be possible in the coming days, but potential is limited by the support.
EUR/JPY
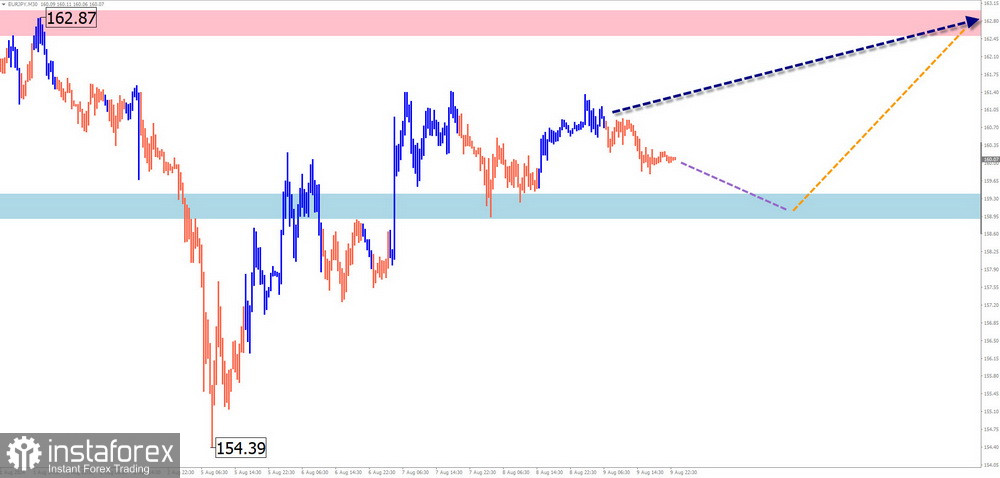
Analysis: On the EUR/JPY pair chart, the short-term trend is set by the downward corrective wave from July 28, at the end of the global bullish trend. The wave structure appears as an extended flat, and as of the analysis, it seems to be fully formed. The upward segment that started on August 5 has reversal potential.
Forecast: The beginning of the upcoming week will likely see the end of the sideways movement. A decline towards the support zone is likely. By the end of the week, a reversal and active growth of the pair are expected. The resistance zone indicates the upper boundary of the expected weekly range.
Potential Reversal Zones:
- Resistance: 162.50/163.00
- Support: 159.40/158.90
Recommendations:
- Sales: Have low potential. It is safer to reduce the volume size in trades.
- Purchases: Conditions for such trades will not be met until confirmed signals appear near the support zone.
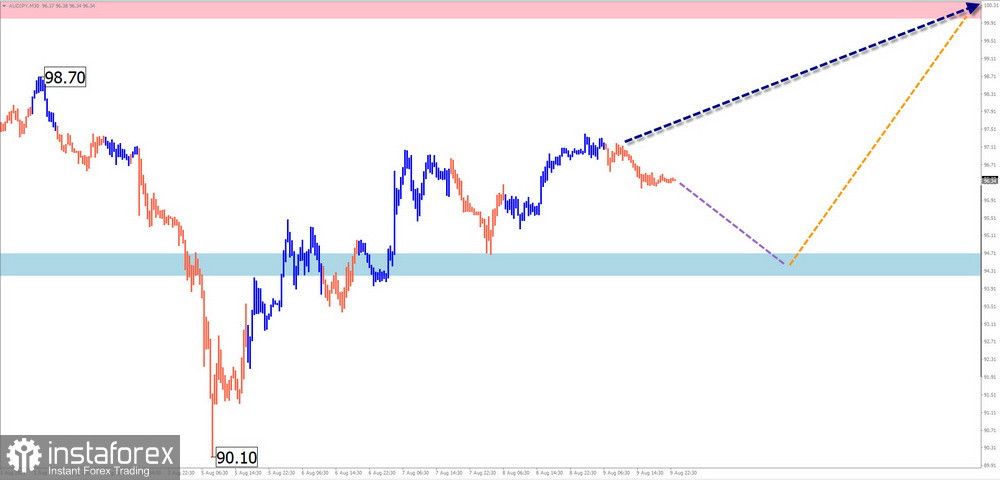
AUD/JPY
Analysis: Since March last year, the AUD/JPY pair has been predominantly moving "north" on the price chart. The unfinished downward wave segment started on July 28. The correction wave formed as an extended flat. The bullish segment, which began on August 5, has a high wave level, exceeding the size of the correction.
Forecast: A general flat movement is expected in the coming week. In the first few days, a downward vector is more likely. By the end of the week, the price growth is expected to resume, with a rise up to the resistance zone.
Potential Reversal Zones:
- Resistance: 100.00/100.50
- Support: 94.70/94.20
Recommendations:
- Purchases: Possible with a reduced volume size within individual sessions.
- Sales: Premature until corresponding signals appear near the resistance.
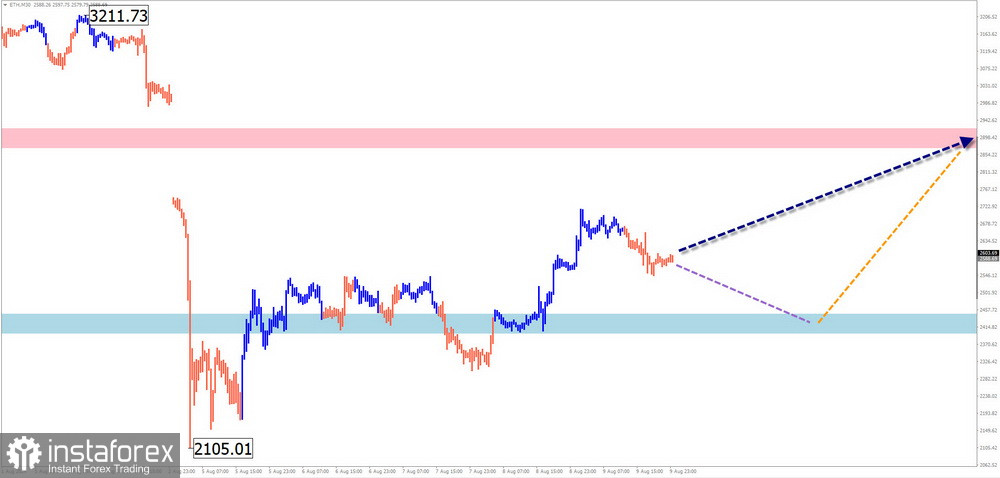
Ethereum
Analysis: The corrective wave of Ethereum, which started in March, is nearing completion. Its structure appears complete as of the analysis. The price rise that began on May 5 formed a reversal wave at a high wave level. After confirmation through a correction, the price growth will continue.
Forecast: In the upcoming week, Ethereum's price is expected to gradually move from the support boundaries to the resistance zone. In the first few days, there is a high likelihood of a sideways movement with a downward vector. A sharp increase in volatility and a breach of the lower support boundary cannot be ruled out during the direction change.
Potential Reversal Zones:
- Resistance: 2870.0/2930.0
- Support: 2450.0/2400.0
Recommendations:
- Sales: Allowed within individual trading sessions with a fractional volume.
- Purchases: Not applicable until confirmed reversal signals appear near the support.
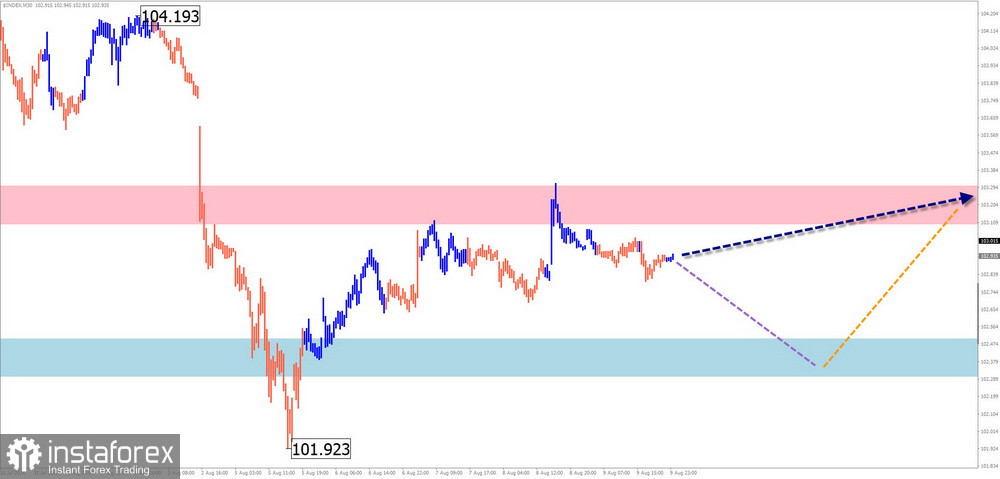
US Dollar Index
Analysis: Considering several factors, the US dollar's downward trend, which has driven its main direction since last autumn, seems to be ending. The counter-movement began on August 5. Its potential suggests the formation of at least a full correction. The price of the index is approaching the first strong resistance zone.
Forecast: The general sideways movement of the dollar index is expected to continue during the upcoming week. In the first few days, a brief decline with pressure on the support zone is possible. The highest activity and a reversal are likely towards the end of the week or the next.
Potential Reversal Zones:
- Resistance: 103.10/103.30
- Support: 102.50/102.30
Recommendations: The tendency for the weakening of national currencies in major pairs is expected to continue in the upcoming week. The best trading results can likely be achieved by continuing bearish trades in these currency pairs throughout the upcoming week.
Explanations: In simplified wave analysis (SWA), all waves consist of 3 parts (A-B-C). On each timeframe, only the last, unfinished wave is analyzed. The formed structure is shown with a solid arrow, and the expected movements are shown with a dashed line.
Note: The wave algorithm does not consider the duration of instrument movements over time!