signal strength 1 of 5

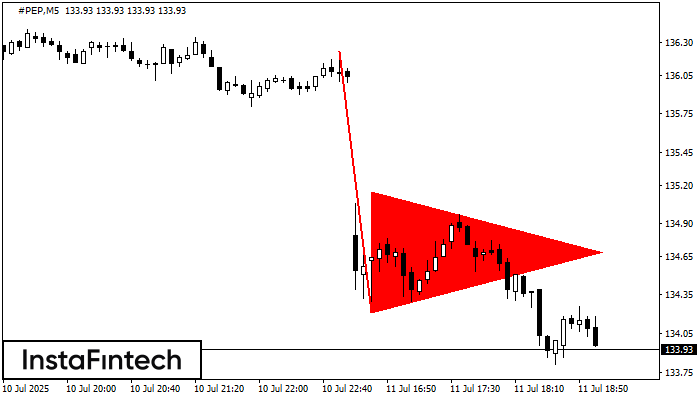
The Bearish pennant pattern has formed on the #PEP M5 chart. It signals potential continuation of the existing trend. Specifications: the pattern’s bottom has the coordinate of 134.22; the projection of the flagpole height is equal to 201 pips. In case the price breaks out the pattern’s bottom of 134.22, the downtrend is expected to continue for further level 134.07.
The M5 and M15 time frames may have more false entry points.
- All
- Double Top
- Flag
- Head and Shoulders
- Pennant
- Rectangle
- Triangle
- Triple top
- All
- #AAPL
- #AMZN
- #Bitcoin
- #EBAY
- #FB
- #GOOG
- #INTC
- #KO
- #MA
- #MCD
- #MSFT
- #NTDOY
- #PEP
- #TSLA
- #TWTR
- AUDCAD
- AUDCHF
- AUDJPY
- AUDUSD
- EURCAD
- EURCHF
- EURGBP
- EURJPY
- EURNZD
- EURRUB
- EURUSD
- GBPAUD
- GBPCHF
- GBPJPY
- GBPUSD
- GOLD
- NZDCAD
- NZDCHF
- NZDJPY
- NZDUSD
- SILVER
- USDCAD
- USDCHF
- USDJPY
- USDRUB
- All
- M5
- M15
- M30
- H1
- D1
- All
- Buy
- Sale
- All
- 1
- 2
- 3
- 4
- 5
The Double Bottom pattern has been formed on NZDCAD M5; the upper boundary is 0.8222; the lower boundary is 0.8216. The width of the pattern is 6 points. In case
The M5 and M15 time frames may have more false entry points.
Open chart in a new windowThe Triple Top pattern has formed on the chart of the GBPJPY M5 trading instrument. It is a reversal pattern featuring the following characteristics: resistance level 1, support level -8
The M5 and M15 time frames may have more false entry points.
Open chart in a new windowAccording to the chart of M30, AUDCAD formed the Bullish Rectangle. This type of a pattern indicates a trend continuation. It consists of two levels: resistance 0.9021 and support 0.9000
Open chart in a new window