EUR/USD
Analysis:
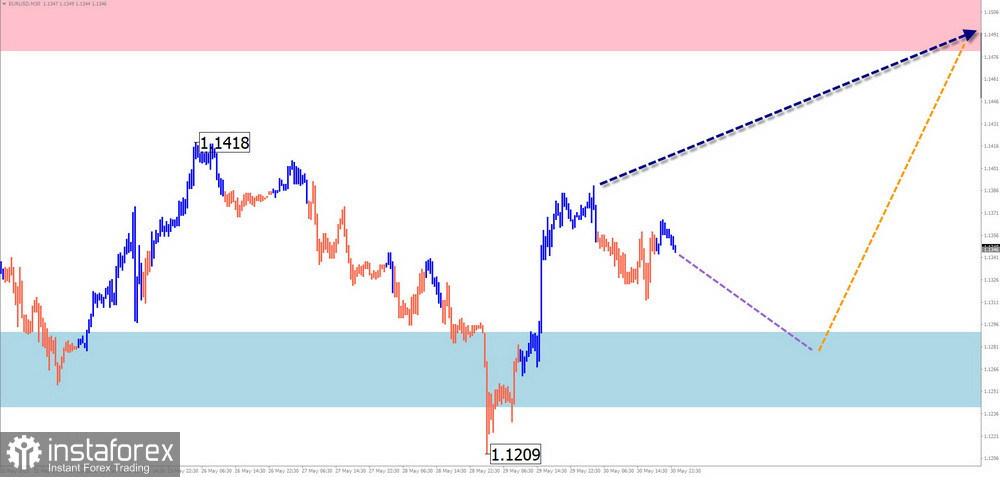
Since February of this year, the euro's price movement has been governed by an upward wave. The downward section since April 11 currently lacks reversal potential and remains within a corrective phase of the trend. Lines drawn through the extremes show a "horizontal pennant" figure, which remains unfinished.
Forecast:
In the coming days, a continuation of the euro's sideways movement is expected. A short-term decline toward the support zone is possible. Afterward, conditions for a reversal may form. The start of an upward move is most likely toward the end of the week.
Potential Reversal Zones:
- Resistance: 1.1480/1.1530
- Support: 1.1290/1.1230
Recommendations:
- Selling: Possible in reduced volume sizes during individual sessions, with a target no higher than the resistance zone.
- Buying: Can be considered after confirmed reversal signals appear near resistance using your trading system (TS).
USD/JPY
Analysis:
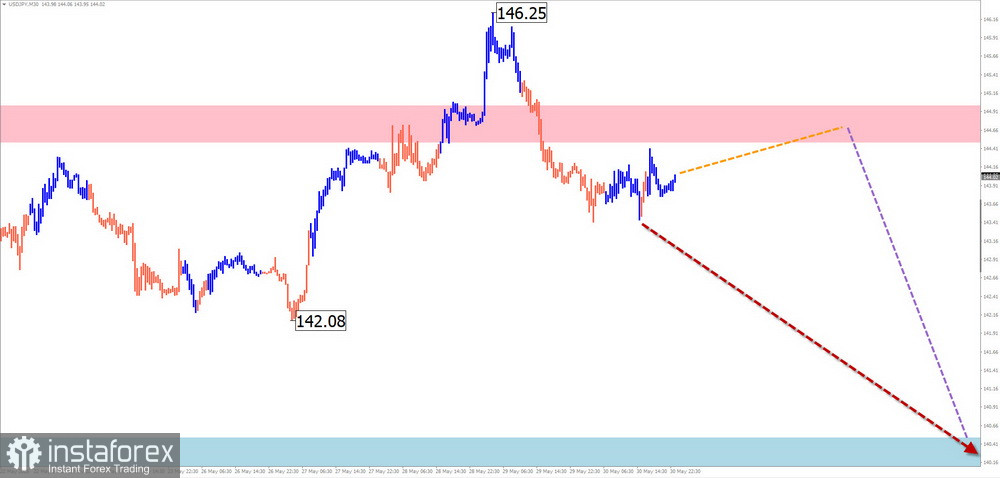
Since December last year, the price movement of the yen major has been driven by a dominant downward wave. Since May 12, the final, yet unfinished part of the wave has been developing. Over the last two weeks, prices have formed an intermediate sideways correction near the resistance zone.
Forecast:
A continuation of the sideways movement is expected throughout the upcoming week, with a potential retest of the resistance zone. In the second half of the week, the likelihood of a reversal and renewed decline increases, but limited to the support boundaries.
Potential Reversal Zones:
- Resistance: 144.50/145.00
- Support: 140.50/140.00
Recommendations:
- Buying: Limited potential; safer within individual sessions using a reduced volume.
- Selling: Could become the main trading direction after confirmed reversal signals appear near resistance.
GBP/JPY
Analysis:
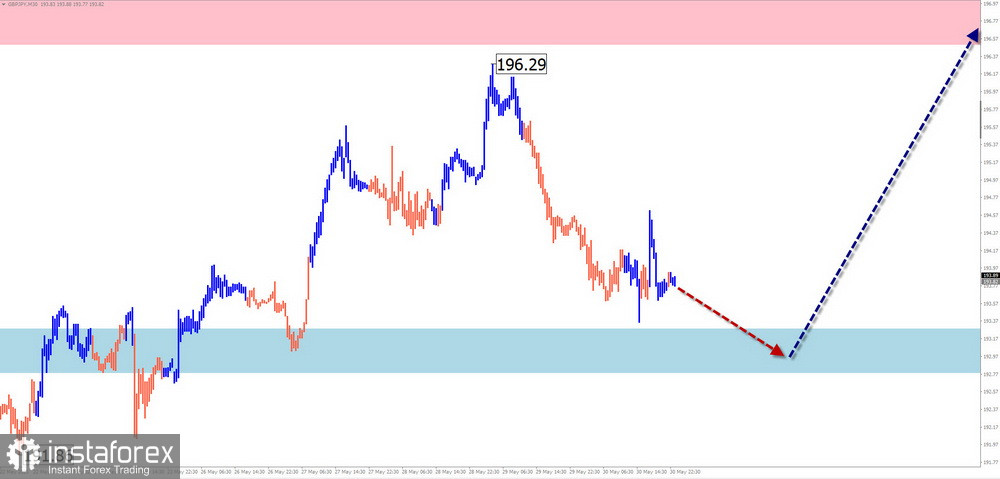
Since April, the short-term movement of the GBP/JPY pair has been driven by an upward wave. Prices have reached the lower boundary of a wide, potentially reversal zone on the weekly timeframe. Over the last two weeks, a sliding plane correction has been forming, which appears incomplete.
Forecast:
The pair is expected to continue its downward movement early in the week until it contacts the support zone. Afterward, a change of course and renewed price growth is anticipated. The resistance zone will limit the upward move.
Potential Reversal Zones:
- Resistance: 196.50/197.00
- Support: 193.30/192.80
Recommendations:
- Selling: Possible with a fractional volume within individual sessions; potential limited by support.
- Buying: Trading should only be considered after confirmed reversal signals appear in the support zone.
USD/CAD
Analysis:
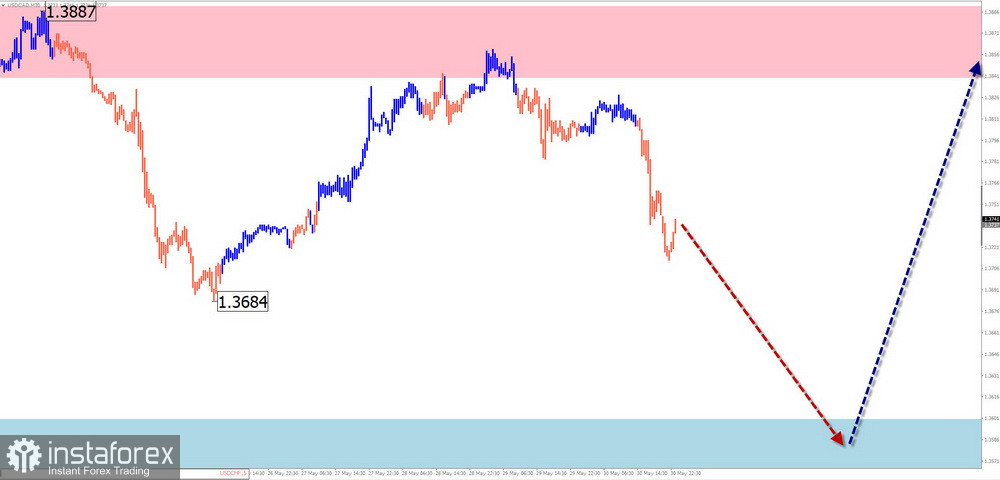
The Canadian dollar major has been developing a downward wave in recent months. The current wave structure suggests it is still incomplete. A correction is overdue. Prices are near the upper boundary of a potential reversal zone on the weekly scale.
Forecast:
A continuation of the sideways movement with a decline toward the support zone is expected in the coming days. A brief dip below the support zone is possible. Afterward, a reversal and the start of price growth are anticipated. The resistance zone shows the upper limit of expected weekly volatility.
Potential Reversal Zones:
- Resistance: 1.3840/1.3890
- Support: 1.3600/1.3550
Recommendations:
- Selling: Possible on an intraday basis with a fractional volume, but not below the calculated support.
- Buying: Should be considered only after confirmed reversal signals appear in the support zone.
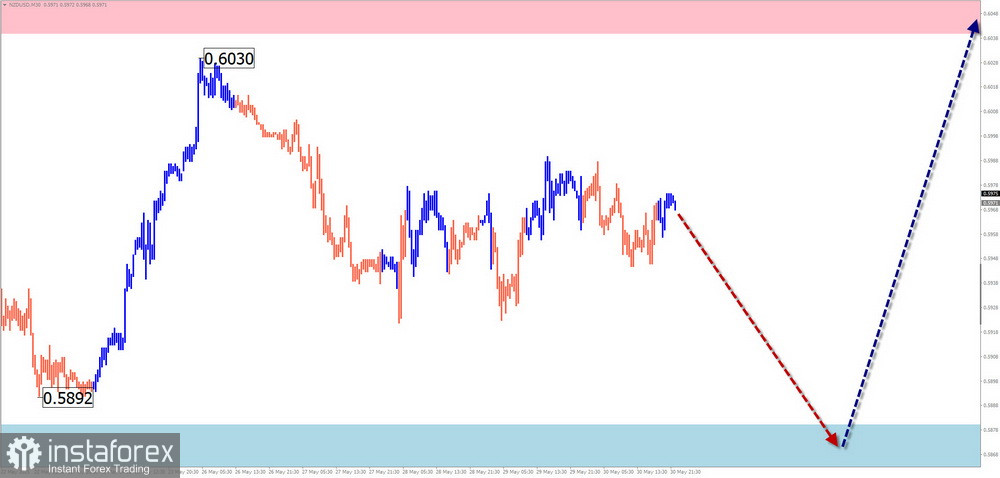
NZD/USD
Brief Analysis:
The New Zealand dollar continues moving sideways within a dominant bullish wave since April. The current wave structure remains incomplete. The downward section since April 22 is considered an internal correction.
Weekly Forecast:
The sideways movement is likely to continue for a few more days. A short-term decline is possible. Before any active growth, some pressure on the support zone cannot be ruled out. The resistance zone marks the upper boundary of the expected weekly movement.
Potential Reversal Zones:
- Resistance: 0.6040/0.6090
- Support: 0.5880/0.5830
Recommendations:
- Selling: Has low potential and may be risky.
- Buying: Can be used after confirmed reversal signals appear near the support zone.
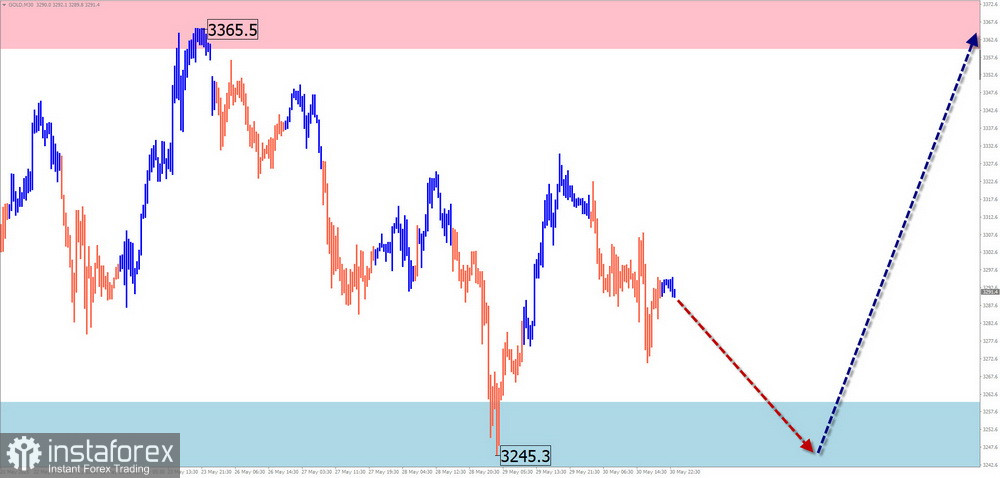
Gold
Analysis:
Since April, gold prices have been moving predominantly sideways. The ongoing downward plane is a correction of the previous bullish trend. The structure does not yet appear complete. Prices are near the lower boundary of the recent months' horizontal channel.
Forecast:
The sideways price movement could end in the next few days. Before that, pressure on the support is likely. Then, a reversal and renewed price growth can be expected. The highest market activity is anticipated closer to the weekend.
Potential Reversal Zones:
- Resistance: 3360.0/3380.0
- Support: 3260.0/3240.0
Recommendations:
- Selling: Has low potential and may lead to losses.
- Buying: Can be considered as the main trading direction after confirmed reversal signals appear in the support zone according to your trading system.
Note: In simplified wave analysis (SWA), all waves consist of 3 parts (A-B-C). Only the last unfinished wave is analyzed on each timeframe. Expected movements are shown with dashed lines.
Attention: The wave algorithm does not account for the duration of instrument movements over time!