GBP/USD
Analysis:
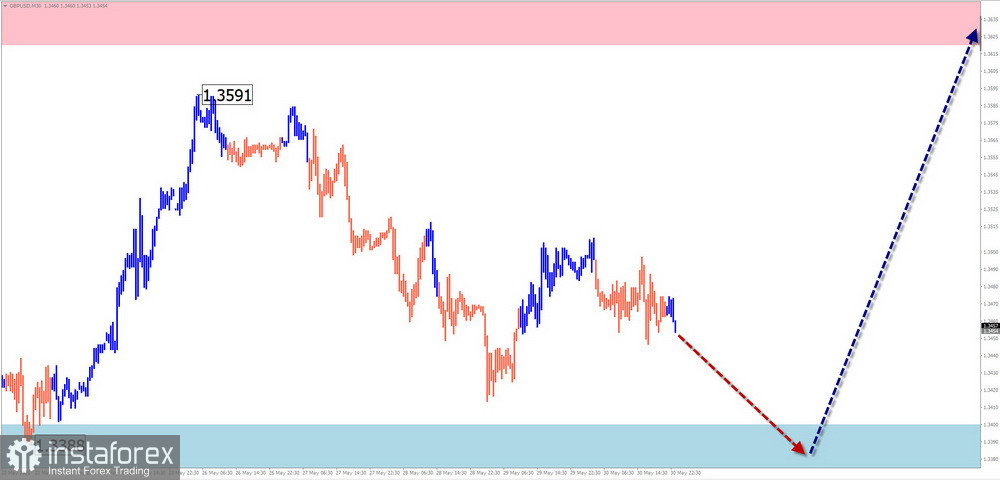
Since April, the dominant upward wave of the British pound has been developing its final (C) part. The wave is forming as an impulse and currently shows no signs of completion. The price has rebounded from the lower boundary of a broad potential reversal zone, forming a correction.
Forecast:
In the coming week, the price is expected to move toward the calculated resistance zone. A downward movement with pressure toward support is possible early in the week. Higher volatility is expected later in the week.
Potential Reversal Zones:
- Resistance: 1.3620/1.3670
- Support: 1.3400/1.3350
Recommendations:
- Selling: Risky, low potential.
- Buying: Could become the main trading direction upon receiving reversal signals according to your trading system (TS).
AUD/USD
Analysis:
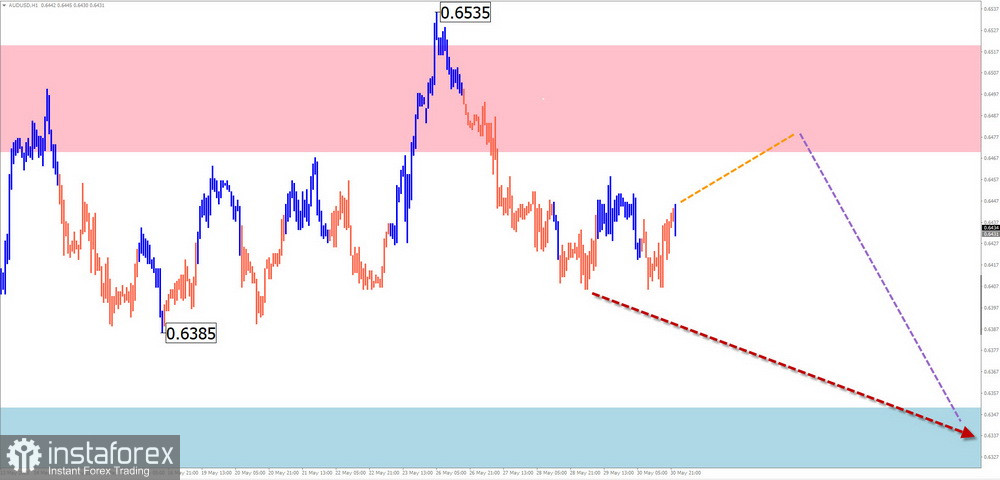
The short-term trend for the Australian dollar has been upward since April. Over the past three weeks, a counter-correction has been forming within the wave, and it is not yet complete.
Forecast:
After a possible rebound toward resistance in the next few days, a reversal and resumption of the pair's price decline is expected. The calculated support marks the upper boundary of the expected target zone for the current bearish wave.
Potential Reversal Zones:
- Resistance: 0.6470/0.6520
- Support: 0.6350/0.6300
Recommendations:
- Buying: Premature until reversal signals appear near the support zone.
- Selling: Can be used for intraday trades with a reduced volume size.
USD/CHF
Analysis:
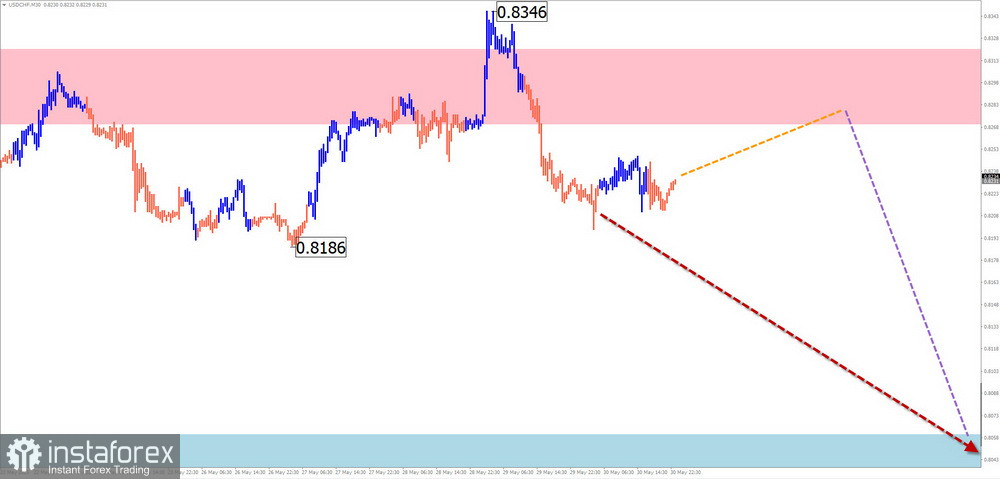
The ongoing short-term wave for the Swiss franc has been upward since mid-April. Prices are forming a sliding plane along the upper boundary of a broad potential reversal zone, which remains incomplete. Its potential is limited to a corrective level.
Forecast:
Sideways movement along the resistance zone is expected in the coming days. A breakout above the upper boundary is unlikely. A price decline could resume later in the week, with increased volatility possibly coinciding with major news releases.
Potential Reversal Zones:
- Resistance: 0.8270/0.8320
- Support: 0.8060/0.8010
Recommendations:
- Buying: High risk, could result in losses.
- Selling: Recommended after confirmed reversal signals near resistance.
EUR/JPY
Analysis:
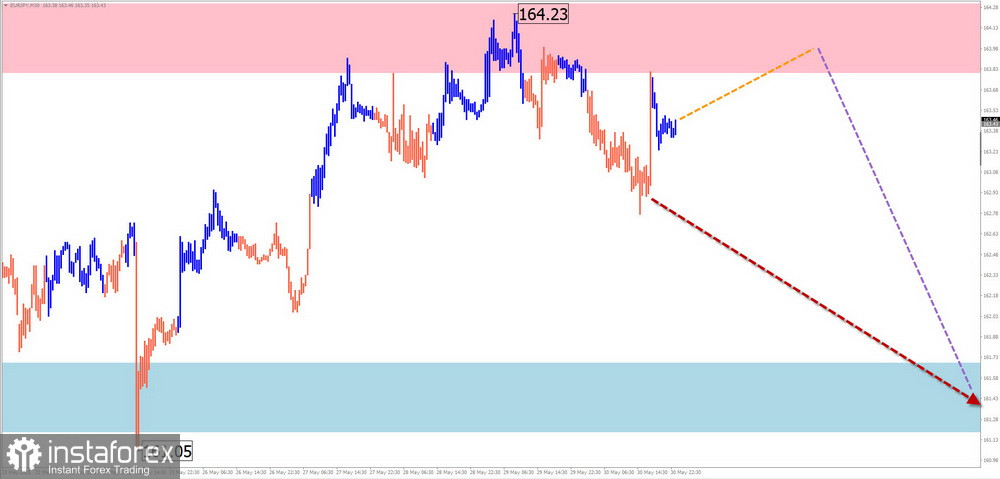
Within the dominant uptrend for the EUR/JPY pair, a correction wave that started on May 2 is developing. A sliding plane is forming, with the final (C) segment still missing. The price is approaching the upper boundary of a broad potential reversal zone on the daily timeframe.
Forecast:
An upward movement is expected in the next couple of days, possibly briefly breaking through the resistance. A reversal and resumption of the downward movement is expected closer to the weekend. The support zone marks the lower boundary of the pair's expected weekly range.
Potential Reversal Zones:
- Resistance: 163.80/164.30
- Support: 161.70/161.20
Recommendations:
- Buying: Low potential and may result in losses.
- Selling: Can become the main trading direction after confirmation of reversal signals according to your TS.
EUR/GBP
Analysis:
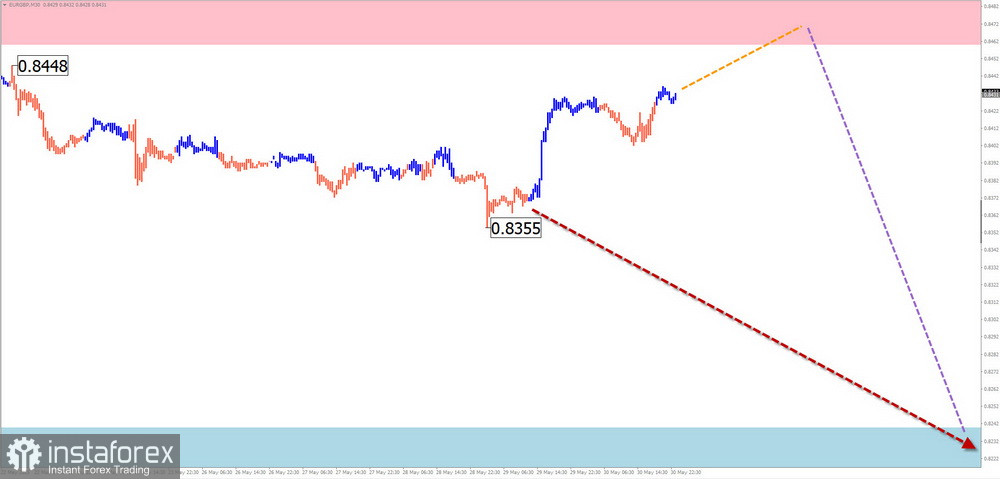
Since mid-April, the short-term movement of the EUR/GBP pair has been driven by a bearish wave. After breaking strong support, prices formed a correction as a horizontal plane. Prices are now at the upper boundary of this range.
Forecast:
After approaching and potentially testing the resistance zone, the pair may reverse to a downward trend in the coming days. The calculated support zone is likely to be the target for the week's movement.
Potential Reversal Zones:
- Resistance: 0.8460/0.8510
- Support: 0.8240/0.8190
Recommendations:
- Selling: Can be used after confirmed reversal signals near resistance.
- Buying: Permissible for intraday trading with fractional volume sizes.
US Dollar Index
Analysis:
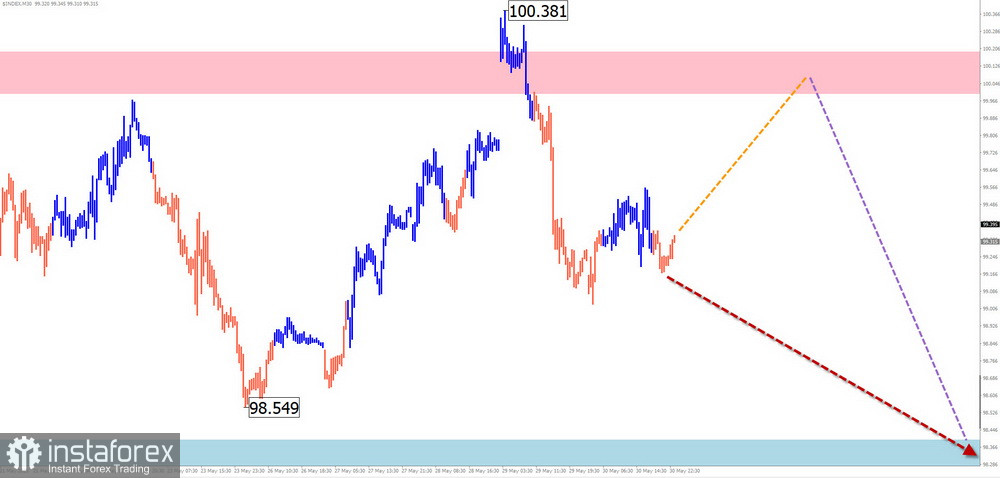
Since April, the US Dollar Index has been moving within an upward-stretched plane. After breaking a strong support zone, the dollar has been moving along its lower boundary. The downward segment from May 29 shows reversal potential.
Forecast:
A general downward vector for the dollar index is expected over the coming week. A brief increase toward resistance is possible early in the week. Volatility is likely to peak by the end of the week.
Potential Reversal Zones:
- Resistance: 100.00/100.20
- Support: 98.50/98.30
Recommendations:
The weakening of the US dollar is expected to continue next week. In trading, a brief rise in major currency pairs against the dollar can be anticipated.
Note: In simplified wave analysis (SWA), all waves consist of three parts (A-B-C). Only the last unfinished wave is analyzed on each timeframe. Expected movements are shown with dashed lines.
Attention: The wave algorithm does not account for the duration of movements over time!