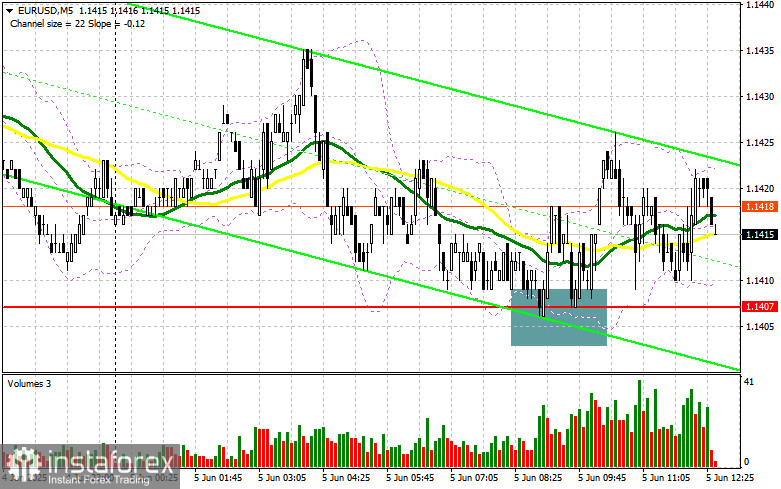
In my morning forecast, I focused on the 1.1407 level and planned to make market entry decisions around it. Let's look at the 5-minute chart and analyze what happened. A decline and the formation of a false breakout around 1.1407 provided an entry point for buying the euro, but as you can see on the chart, a major rally in the pair did not materialize. The technical picture was not revised for the second half of the day.
For opening long positions on EUR/USD:
Data from Germany and the eurozone was largely ignored, as all attention is focused on the ECB's interest rate decision and the new forecasts the regulator is expected to publish. But aside from the ECB decision, which I discussed in detail this morning, we also await several data releases from the U.S. The number of initial jobless claims and changes in labor productivity in the non-manufacturing sector, along with changes in labor costs, are unlikely to have a major impact on the market but still need to be analyzed. It is also worth listening to the final speeches from FOMC members Patrick T. Harker and Jeffrey Schmid before the usual blackout period ahead of the Fed meeting.
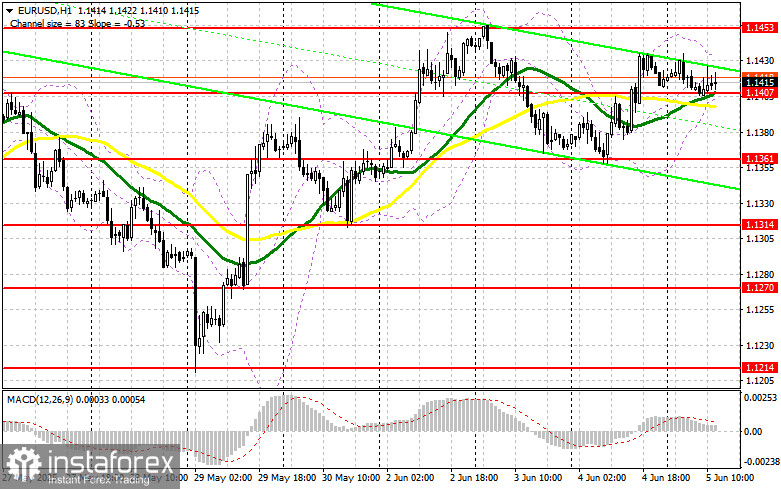
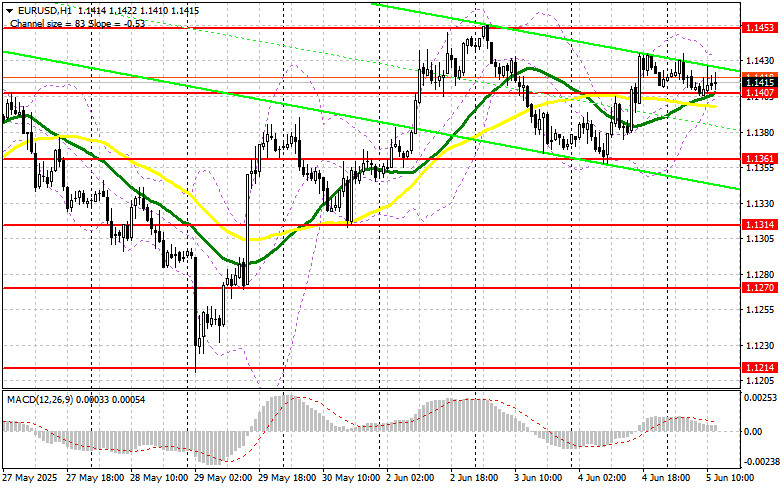
If the pair declines after Lagarde's comments, the focus will shift to defending the 1.1407 support. A false breakout there, similar to what was discussed above, will be a reason to buy EUR/USD in anticipation of updating the high around 1.1453. A breakout and retest of this range will confirm a correct entry point toward the 1.1490 level. The ultimate target will be the 1.1530 level, where I plan to take profit. In the case of a decline in EUR/USD and lack of activity around 1.1407, pressure on the pair will quickly increase, leading to a larger drop. Bears could reach 1.1361. Only after forming a false breakout there will I consider buying the euro. Alternatively, I plan to open long positions immediately on a rebound from 1.1314, aiming for an intraday correction of 30–35 points.
For opening short positions on EUR/USD:
Sellers attempted in the first half of the day but failed to break below 1.1407, indicating a wait-and-see stance among major players ahead of the ECB meeting. It's best to wait for U.S. statistics and market reaction before making decisions.
A false breakout around the 1.1453 resistance will be a signal for short positions, targeting a decline to the 1.1407 support, where moving averages that favor the bulls are located. A breakout and consolidation below this range will provide a suitable selling opportunity toward 1.1361. The ultimate target will be the 1.1314 level, where I will take profits. If EUR/USD rises in the second half of the day and there is no bearish activity around 1.1453, buyers could achieve a larger rally and update 1.1490 — a new monthly high. I will sell there only after a failed consolidation. Alternatively, I plan to open short positions immediately on a rebound from 1.1530, targeting a 30–35 point downward correction.
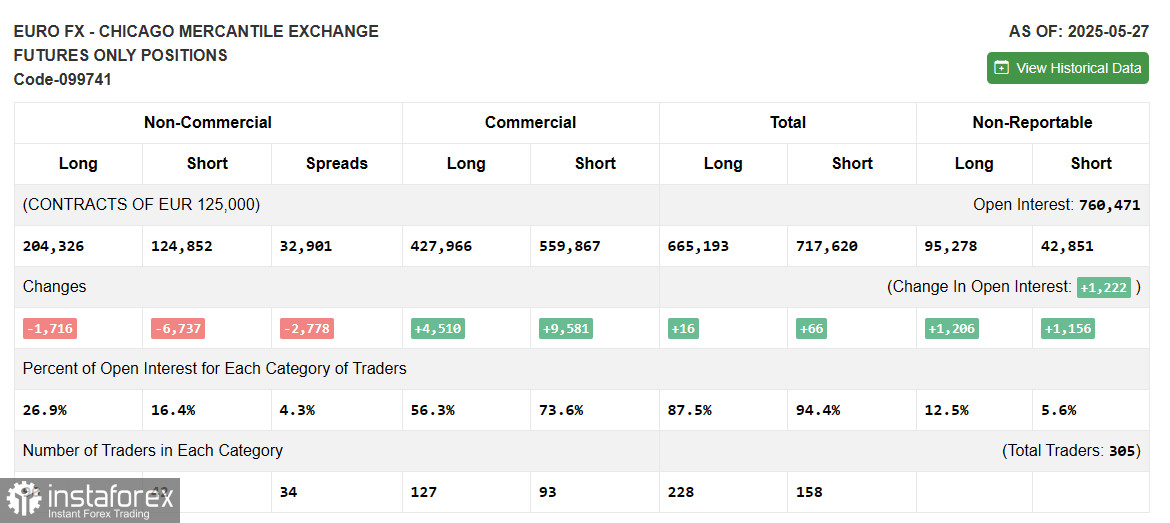
In the COT report (Commitment of Traders) for May 27, both long and short positions declined. However, it is clear that the advantage remains with the buyers. Traders are preparing for the upcoming ECB meeting, where another rate cut is expected. But many economists also suggest that this will be the last cut before a considerable pause in this cycle, which could help strengthen the euro in the short term. Add to that the U.S. GDP report and labor market data, and the week promises to be quite heated. The COT report showed that long non-commercial positions decreased by 1,716 to 204,326, while short non-commercial positions fell by 6,737 to 124,852. As a result, the gap between long and short positions narrowed by 2,778.
Indicator Signals:
Moving Averages
Trading is occurring around the 30- and 50-period moving averages, indicating market uncertainty.
Note: The periods and prices of the moving averages are based on the author's analysis of the H1 chart and differ from the classic daily moving averages on the D1 chart.
Bollinger Bands
In case of a decline, the lower boundary of the indicator around 1.1407 will serve as support.
Description of Indicators: • Moving average: Determines the current trend by smoothing out volatility and noise. 50-period — marked in yellow on the chart; 30-period — marked in green; • MACD (Moving Average Convergence/Divergence): Fast EMA — 12-period; Slow EMA — 26-period; SMA — 9-period; • Bollinger Bands: 20-period; • Non-commercial traders: Speculators such as individual traders, hedge funds, and large institutions using the futures market for speculative purposes; • Long non-commercial positions: The total long open positions held by non-commercial traders; • Short non-commercial positions: The total short open positions held by non-commercial traders; • Net non-commercial position: The difference between the short and long positions of non-commercial traders.