empty
08.07.2025 08:00 PM
EUR/USD Analysis on July 8, 2025

This image is no longer relevant

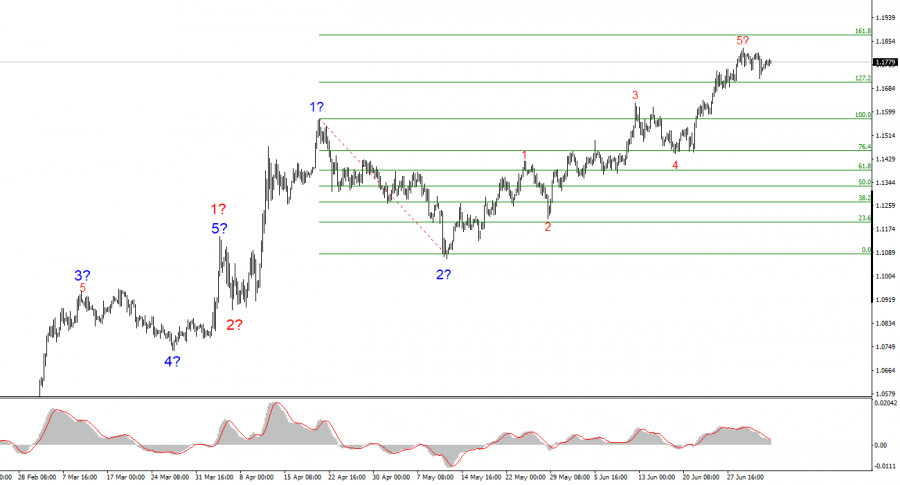
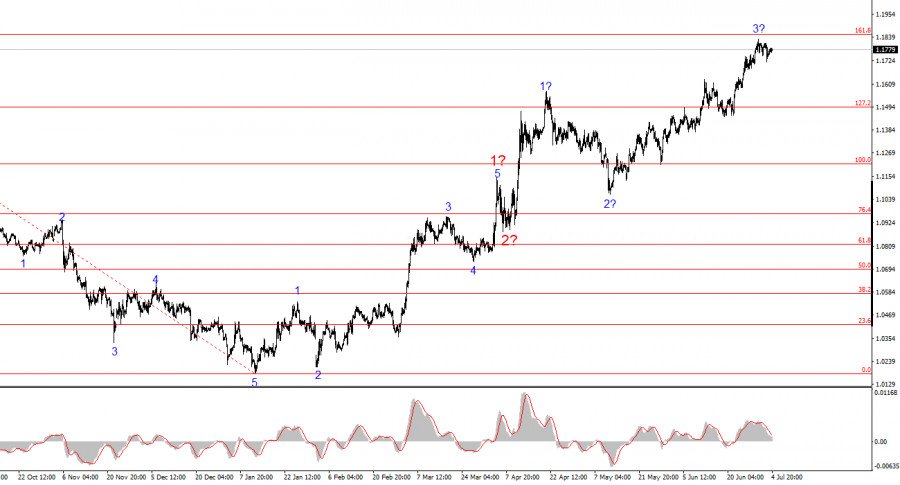
The wave pattern on the 4-hour EUR/USD chart has remained consistent for several months. The upward trend segment continues to form, and the news backdrop continues to support all currencies except the U.S. dollar. The trade war initiated by Donald Trump was intended to increase budget revenues and reduce the trade deficit. However, these targets have yet to be achieved. Trade agreements are being signed slowly, and Trump's "One Big Law" is projected to raise the U.S. national debt by 3 trillion dollars over the coming years. Markets have given a low assessment of Trump's first six months in office, viewing his actions as a risk to U.S. stability and economic wellbeing.

Currently, wave 3 is likely still under construction and may eventually extend much further. However, its internal structure has taken on a five-wave form, which could mean it is complete. If the current wave count is accurate, then prices may continue to rise in the coming months. In the short term, however, a corrective wave sequence may form. The U.S. dollar will remain under pressure unless Donald Trump completely reverses his trade policy. The likelihood of that happening is very low, though Trump is known for being unpredictable.

The EUR/USD rate showed no significant change on Tuesday. The euro has been gradually declining for more than a week, and market behavior suggests that investors are pausing and locking in profits rather than buying the dollar. Broadly speaking, conditions in the currency market remain unchanged. New data comes in, older data fades, but the overall picture stays the same. The market had no interest in buying the dollar one month ago or three months ago, and that sentiment persists—largely because the global trade war shows no signs of nearing resolution.

Moreover, some anticipate a resolution to the trade war, but such an outcome remains uncertain. A complete end to the trade conflict would, in my view, require the full removal of all tariffs. This scenario does not appear likely under Donald Trump. As a result, the most realistic outcome may be a reduction in tariffs for most U.S. trading partners. However, considering that only 3 agreements have been signed out of 75 after three months of negotiations, the likelihood of even this outcome seems low.

It's also worth noting that three months ago, Trump effectively lowered tariffs to minimal levels. Did that help the dollar? The market viewed it as a temporary move and anticipated future increases. Even the three signed agreements imply substantially higher tariffs for China, Vietnam, and the United Kingdom than the standard 10%. Today, Trump announced tariff hikes to 25–40% for 15 countries on his list. These increases will take effect on August 1, and much can still happen before then. Still, the focus remains on further tariff hikes.

Based on all of the above, new tariffs and tariff increases continue to be a reason for markets to sell the dollar. Tariff reductions and trade deals do not appear to boost demand for the dollar.

This image is no longer relevant

Key Takeaways

Based on this EUR/USD analysis, I conclude that the pair continues to form an upward trend segment. The wave count remains entirely dependent on the news background related to Trump's decisions and U.S. foreign policy, with no clear signs of improvement. The target for wave 3 may extend to the 1.2500 level. I continue to view long positions with targets near 1.1875, which corresponds to the 161.8% Fibonacci level. In the near term, a corrective wave sequence may emerge. New long positions should be considered once this correction is complete.

Core Principles of My Analysis

  1. Wave structures should be simple and clear. Complex patterns are harder to trade and often subject to change.
  2. If there is uncertainty about market conditions, it is better to stay out.
  3. Full confidence in market direction is never possible. Always use Stop Loss orders.
  4. Wave analysis can be combined with other types of analysis and trading strategies.
Chin Zhao,
انسٹافاریکس کا تجزیاتی ماہر
© 2007-2025
Summary
Urgency
Analytic
Alexander Dneprovskiy
Start trade
انسٹافاریکس کے ساتھ کرپٹو کرنسی کی معاملاتی تبدیلیوں سے کمائیں۔
میٹا ٹریڈر 4 ڈاؤن لوڈ کریں اور اپنی پہلی ٹریڈ کھولیں۔
  • Grand Choice
    Contest by
    InstaForex
    InstaForex always strives to help you
    fulfill your biggest dreams.
    مقابلہ میں شامل ہوں

تجویز کردہ مضامین

یورو / یو ایس ڈی کا تجزیہ برائے 12 اگست 2025

یورو / یو ایس ڈی کے 4 گھنٹے کے چارٹ پر لہر کا ڈھانچہ کئی مہینوں سے بدستور برقرار ہے، جو بہت حوصلہ افزا ہے۔ یہاں تک کہ جب اصلاحی

Chin Zhao 20:50 2025-08-12 UTC+2

جی بی پی / یو ایس ڈی کا تجزیہ برائے 12 اگست 2025

جی بی پی / یو ایس ڈی کے لیے، لہر کا ڈھانچہ بلش امپلس ویو پیٹرن کی تشکیل کی نشاندہی کرتا رہتا ہے۔ لہر کی تصویر تقریباً یورو

Chin Zhao 20:37 2025-08-12 UTC+2

یورو / یو ایس ڈی تجزیہ برائے 31 جولائی 2025

یورو / یو ایس ڈی کے لیے 4 گھنٹے کے چارٹ پر لہر کا نمونہ کئی مہینوں سے بدستور برقرار ہے۔ رجحان کا اوپر کی طرف حصہ بننا جاری ہے،

Chin Zhao 21:10 2025-07-31 UTC+2

جی بی پی / یو ایس ڈی کا تجزیہ برائے 31 جولائی 2025

جی بی پی / یو ایس ڈی کے لیے لہر کا نمونہ تیزی کے تسلسل کی لہر کے ڈھانچے کی ترقی کی نشاندہی کرتا ہے۔ لہر کی ترتیب یورو

Chin Zhao 21:05 2025-07-31 UTC+2

جولائی 29 کو یورو / یو ایس ڈی: بلز مارکیٹ کو 1.189 کی سطح کی طرف دھکیل سکتے ہیں

طویل مدت میں، یورو / یو ایس ڈی مارکیٹ ایک بڑی تیزی کی اصلاح (بی) تشکیل دے رہی ہے، جو معیاری اے بی سی زگ زیگ کی شکل اختیار

Roman Onegin 19:06 2025-07-29 UTC+2

یورو / یو ایس ڈی کا تجزیہ برائے 17 جولائی 2025

یورو / یو ایس ڈی کے لیے 4 گھنٹے کے چارٹ پر لہر کا پیٹرن مسلسل کئی مہینوں سے غیر تبدیل شدہ ہے۔ اوپر کی طرف رجحان والے

Chin Zhao 21:57 2025-07-16 UTC+2

جولائی 16 2025 کو جی بی پی / یو ایس ڈی تجزیہ

جی بی پی / یو ایس ڈی کے لیے لہر کا پیٹرن بلش امپلس ویو پیٹرن کی تشکیل کی نشاندہی کرتا ہے۔ لہر کی ترتیب تقریباً یورو

Chin Zhao 21:53 2025-07-16 UTC+2

یورو / یو ایس ڈی کا تجزیہ برائے 30 جون 2025

یورو / یو ایس ڈی کے لیے 4 گھنٹے کے چارٹ پر لہر کا پیٹرن اوپر کی طرف رجحان والے حصے کی تشکیل کی نشاندہی کرتا ہے۔ 28 فروری تک،

Chin Zhao 20:17 2025-06-30 UTC+2

جی بی پی / یو ایس ڈی : تجزیہ اور پیشن گوئی

جی بی پی / یو ایس ڈی کے لیے لہر کا پیٹرن اوپر کی طرف آنے والی لہر کے پیٹرن کی تشکیل کی تجویز کرتا ہے۔ لہر کی تصویر تقریباً

Chin Zhao 20:14 2025-06-30 UTC+2

یورو / یو ایس ڈی کا تجزیہ برائے 23 جون 2025

یہ کہ 4 گھنٹے کے یورو / یو ایس ڈی چارٹ کا لہر پیٹرن اوپر کی طرف رجحان والے حصے کی ترقی کی نشاندہی کرتا ہے۔ یہ تبدیلی

Chin Zhao 19:35 2025-06-23 UTC+2
ابھی فوری بات نہیں کرسکتے ؟
اپنا سوال پوچھیں بذریعہ چیٹ.
Widget callback
 

Dear visitor,

Your IP address shows that you are currently located in the USA. If you are a resident of the United States, you are prohibited from using the services of InstaFintech Group including online trading, online transfers, deposit/withdrawal of funds, etc.

If you think you are seeing this message by mistake and your location is not the US, kindly proceed to the website. Otherwise, you must leave the website in order to comply with government restrictions.

Why does your IP address show your location as the USA?

  • - you are using a VPN provided by a hosting company based in the United States;
  • - your IP does not have proper WHOIS records;
  • - an error occurred in the WHOIS geolocation database.

Please confirm whether you are a US resident or not by clicking the relevant button below. If you choose the wrong option, being a US resident, you will not be able to open an account with InstaForex anyway.

We are sorry for any inconvenience caused by this message.