

signal strength 1 of 5
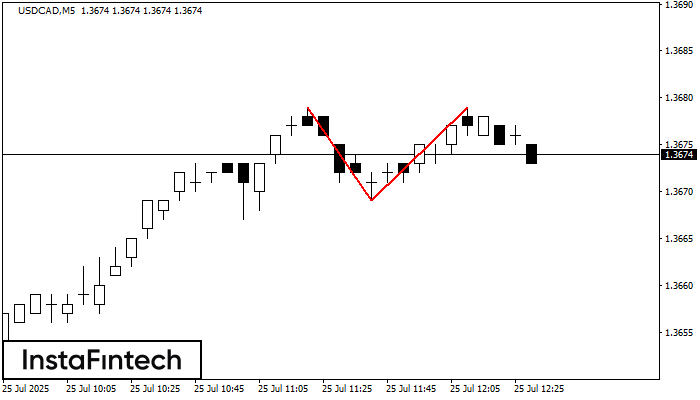
The Double Top reversal pattern has been formed on USDCAD M5. Characteristics: the upper boundary 1.3679; the lower boundary 1.3669; the width of the pattern is 10 points. Sell trades are better to be opened below the lower boundary 1.3669 with a possible movements towards the 1.3654 level.
The M5 and M15 time frames may have more false entry points.
یہ بھی دیکھیں
- All
- Double Top
- Flag
- Head and Shoulders
- Pennant
- Rectangle
- Triangle
- Triple top
- All
- #AAPL
- #AMZN
- #Bitcoin
- #EBAY
- #FB
- #GOOG
- #INTC
- #KO
- #MA
- #MCD
- #MSFT
- #NTDOY
- #PEP
- #TSLA
- #TWTR
- AUDCAD
- AUDCHF
- AUDJPY
- AUDUSD
- EURCAD
- EURCHF
- EURGBP
- EURJPY
- EURNZD
- EURRUB
- EURUSD
- GBPAUD
- GBPCHF
- GBPJPY
- GBPUSD
- GOLD
- NZDCAD
- NZDCHF
- NZDJPY
- NZDUSD
- SILVER
- USDCAD
- USDCHF
- USDJPY
- USDRUB
- All
- M5
- M15
- M30
- H1
- D1
- All
- Buy
- Sale
- All
- 1
- 2
- 3
- 4
- 5
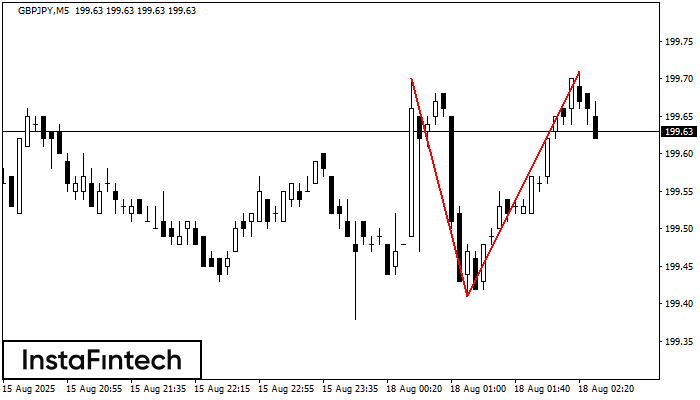
The Double Top reversal pattern has been formed on GBPJPY M5. Characteristics: the upper boundary 199.70; the lower boundary 199.41; the width of the pattern is 30 points. Sell trades
The M5 and M15 time frames may have more false entry points.
Open chart in a new window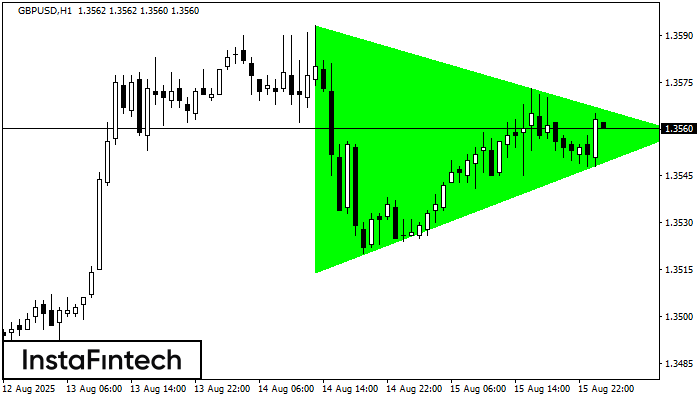
According to the chart of H1, GBPUSD formed the Bullish Symmetrical Triangle pattern. The lower border of the pattern touches the coordinates 1.3514/1.3559 whereas the upper border goes across 1.3593/1.3559
Open chart in a new window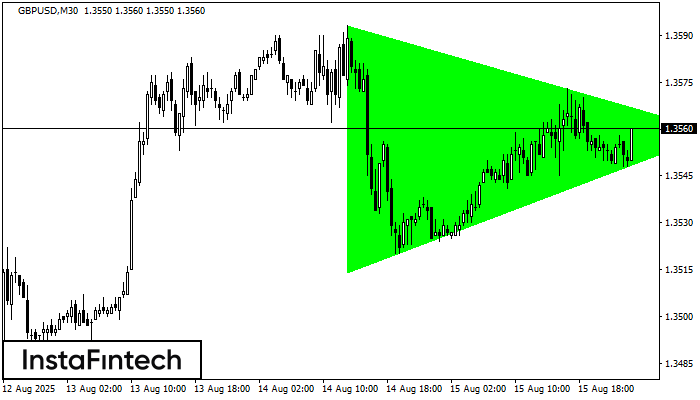
According to the chart of M30, GBPUSD formed the Bullish Symmetrical Triangle pattern, which signals the trend will continue. Description. The upper border of the pattern touches the coordinates 1.3593/1.3559
Open chart in a new window


