signal strength 1 of 5
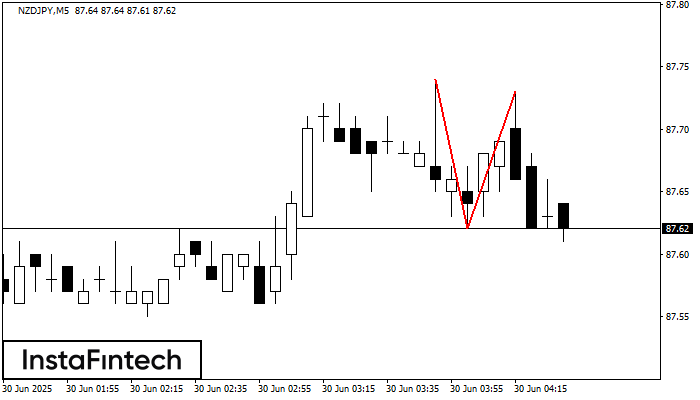
The Double Top reversal pattern has been formed on NZDJPY M5. Characteristics: the upper boundary 87.74; the lower boundary 87.62; the width of the pattern is 11 points. Sell trades are better to be opened below the lower boundary 87.62 with a possible movements towards the 87.47 level.
The M5 and M15 time frames may have more false entry points.
See Also
- All
- Double Top
- Flag
- Head and Shoulders
- Pennant
- Rectangle
- Triangle
- Triple top
- All
- #AAPL
- #AMZN
- #Bitcoin
- #EBAY
- #FB
- #GOOG
- #INTC
- #KO
- #MA
- #MCD
- #MSFT
- #NTDOY
- #PEP
- #TSLA
- #TWTR
- AUDCAD
- AUDCHF
- AUDJPY
- AUDUSD
- EURCAD
- EURCHF
- EURGBP
- EURJPY
- EURNZD
- EURRUB
- EURUSD
- GBPAUD
- GBPCHF
- GBPJPY
- GBPUSD
- GOLD
- NZDCAD
- NZDCHF
- NZDJPY
- NZDUSD
- SILVER
- USDCAD
- USDCHF
- USDJPY
- USDRUB
- All
- M5
- M15
- M30
- H1
- D1
- All
- Buy
- Sale
- All
- 1
- 2
- 3
- 4
- 5
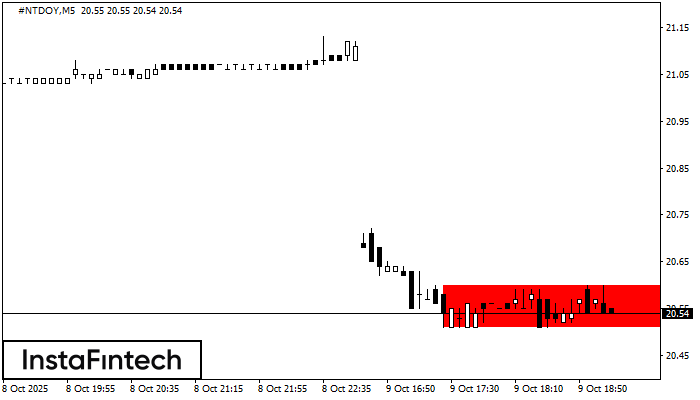
According to the chart of M5, #NTDOY formed the Bearish Rectangle. This type of a pattern indicates a trend continuation. It consists of two levels: resistance 20.60 - 0.00
The M5 and M15 time frames may have more false entry points.
Open chart in a new window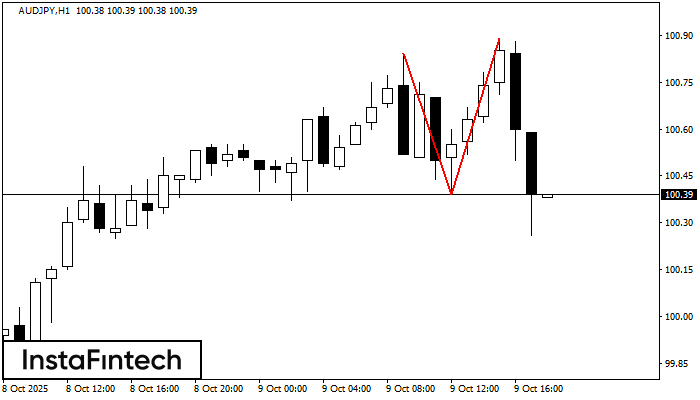
The Double Top reversal pattern has been formed on AUDJPY H1. Characteristics: the upper boundary 100.84; the lower boundary 100.39; the width of the pattern is 50 points. Sell trades
Open chart in a new window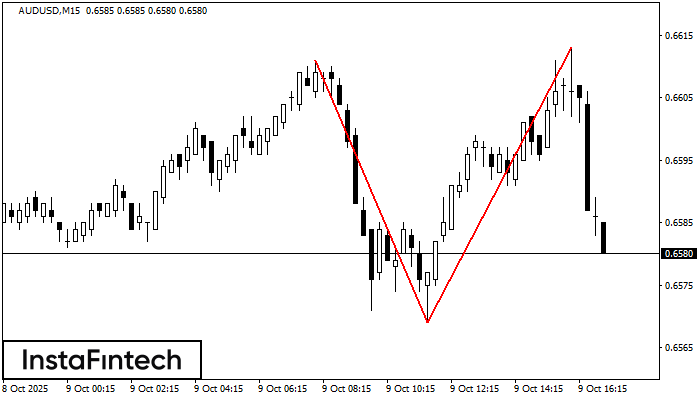
The Double Top pattern has been formed on AUDUSD M15. It signals that the trend has been changed from upwards to downwards. Probably, if the base of the pattern 0.6569
The M5 and M15 time frames may have more false entry points.
Open chart in a new window