EUR/USD
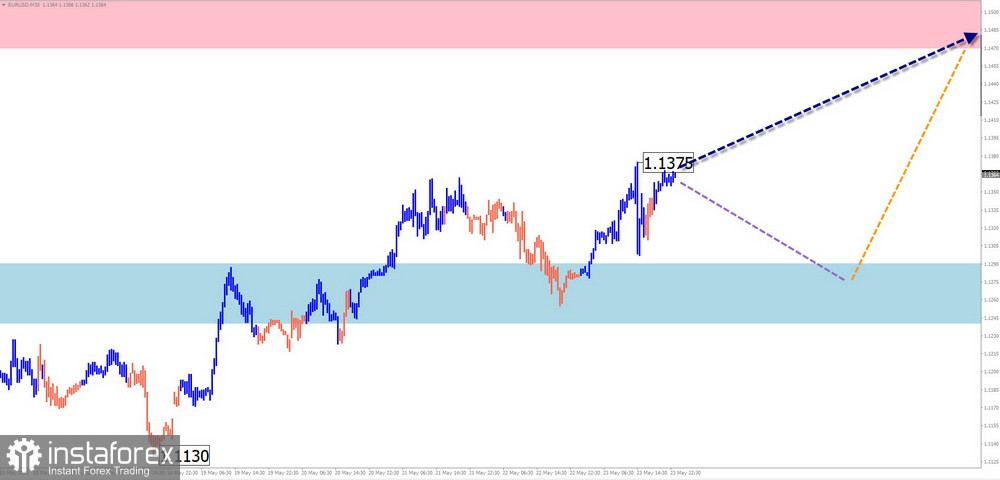
Analysis: Since April, the euro's primary pair has been forming a descending horizontal pennant. From a strong, potentially reversal zone on the daily timeframe in mid-May, the price began to rise, forming a corrective wave segment. The structure of this segment has not yet been completed.
Forecast: In the upcoming week, a continuation of the general sideways movement is expected. A brief decline and pressure on the support zone may occur at the beginning of the week. Afterward, a reversal and resumption of the bullish trend toward the resistance zone are likely. The most active phase of upward movement may occur closer to the weekend.
Potential Reversal Zones
- Resistance: 1.1470 / 1.1520
- Support: 1.1290 / 1.1240
Recommendations:
Sales: High risk, low potential.Purchases: Possible after confirmation signals appear near support on your trading system.
USD/JPY
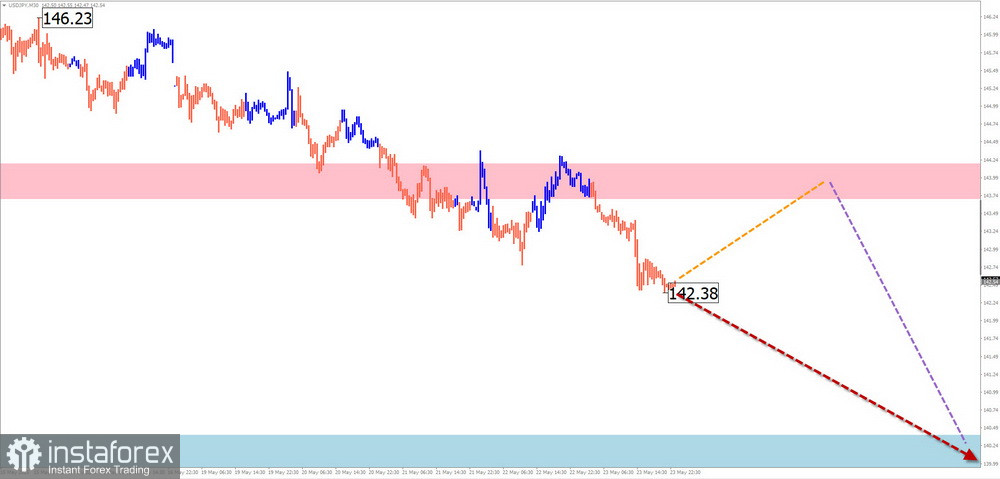
Analysis: The dominant bearish wave for the yen major has been forming since December. The counter-trend correction (B) appears complete. The downward move since May 12 has reversal potential. If confirmed, it could mark the start of the final wave (C). The calculated support is at the upper edge of the prior target zone.
Forecast: Next week, the pair is likely to continue moving sideways. The start of the week may be flat. Short-term pressure on the resistance zone is possible in the first few days. The second half of the week may bring activation and the beginning of a downward move.
Potential Reversal Zones
- Resistance: 143.70 / 144.20
- Support: 140.40 / 139.90
Recommendations:
Sales: Optimal entry zone is at resistance. Downward potential is limited by support.
Purchases: Risky and low potential. Reduce volume size for safety.
GBP/JPY
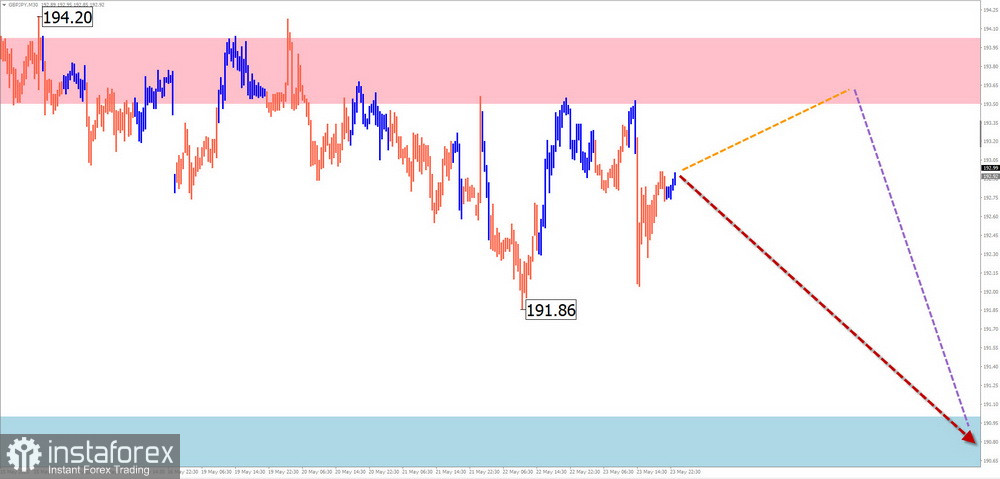
Analysis:The short-term trend of the pound/yen pair has been upward in recent months. Since early May, the pair has been forming a counter-trend corrective phase, which is still incomplete. A contracting flat appears to be developing.
Forecast: Next week, expect price movement between the nearest opposing zones. In the coming days, resistance may be tested. A brief breakout above the upper boundary is possible before a decline toward calculated support. The highest volatility is expected closer to the weekend.
Potential Reversal Zones
- Resistance: 193.50 / 194.00
- Support: 191.00 / 190.50
Recommendations:
Purchases: Lack potential.Sales: Could become the main direction after confirmed reversal signals near resistance.
USD/CAD
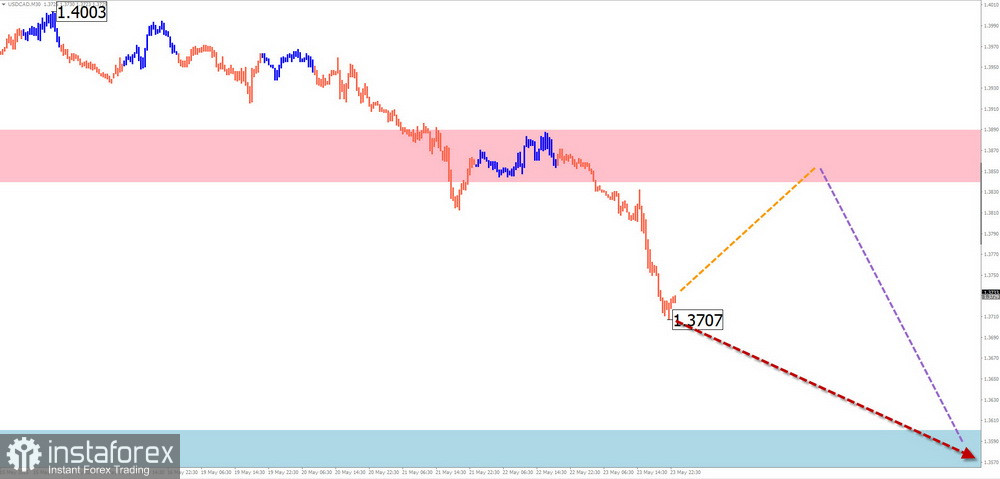
Analysis: Since February, the trend in USD/CAD has been downward. The move from April 16 has reversal potential, exceeding the depth of the previous correction. The calculated support lies at the upper boundary of a large potential reversal zone.
Forecast: The downtrend is expected to continue next week. Price may trade sideways early in the week, with a possible pullback toward resistance. Stronger volatility and renewed downside pressure may appear closer to the weekend.
Potential Reversal Zones
- Resistance: 1.3840 / 1.3890
- Support: 1.3600 / 1.3550
Recommendations:
Sales: Premature until confirmed reversal signals appear near support.Purchases: Low potential and risky.
NZD/USD
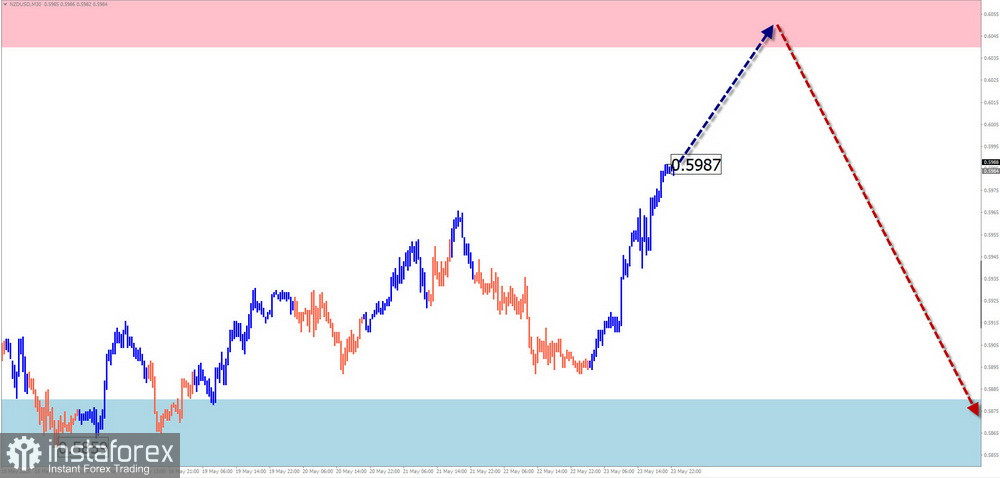
Brief Analysis: Since April, NZD/USD has formed an ascending zigzag wave. Over the past four weeks, the price has drifted sideways. Wave extremes form a "descending contracting flat" pattern. Its structure suggests the final segment is underway.
Weekly Forecast: Early next week, a rise toward calculated resistance is likely. In the second half, volatility may increase with a potential shift toward a decline. The move downward could extend toward calculated support within the weekly period.
Potential Reversal Zones
- Resistance: 0.6040 / 0.6090
- Support: 0.5880 / 0.5830
Recommendations:
Purchases: Possible with small volume sizes intraday. Limited by resistance.Sales: Could become the main strategy after confirmed signals near resistance.
Gold
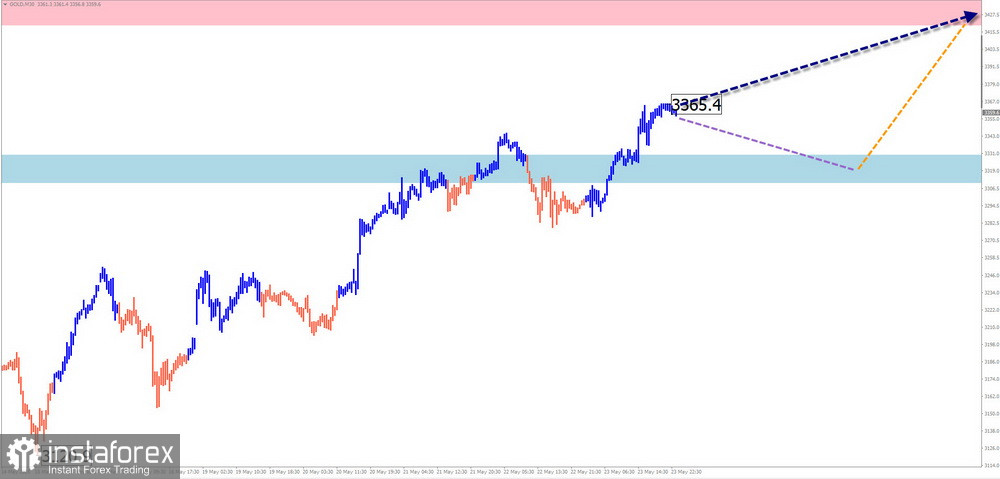
Analysis: Since mid-April, gold has been in a downtrend. Wave highs and lows form a contracting flat. The final segment of the wave is currently developing, and a temporary pullback has formed in recent days.
Forecast: At the start of next week, expect continued flat trading. A brief decline toward support is possible. In the second half of the week, higher volatility is expected, with a possible reversal and a rise toward resistance. A breakout above the upper resistance is unlikely during the upcoming week.
Potential Reversal Zones
- Resistance: 3420.0 / 3440.0
- Support: 3330.0 / 3310.0
Recommendations:
Purchases: Valid upon formation of reversal signals near calculated support.Sales: May be profitable with precise timing during individual sessions and reduced volume size.
Notes: In Simplified Wave Analysis (SWA), all waves consist of 3 parts (A–B–C). Only the most recent incomplete wave is analyzed on each timeframe. Dashed lines represent expected future movement.
Attention: The wave algorithm does not account for the duration of price movements over time.