GBP/USD 5-Minute Analysis
On Wednesday, the GBP/USD currency pair crashed for no apparent reason. There was no major news in either the UK or the US that could have triggered a nearly 200-point drop in the value of the pound sterling. However, from a technical standpoint, the price corrected perfectly to the Senkou Span B line after a strong rally, as seen on the 4-hour timeframe. Since there were no apparent reasons for the collapse of the British currency—and certainly none for the dollar's rise—we believe that market makers executed a manipulation aimed at triggering stop-losses among traders. Again, there were no valid reasons for such a fall.
Of course, any market movement can be explained in hindsight. But this case is different. Last week and this week, both Jerome Powell and Andrew Bailey made several speeches; however, on Wednesday, there were no major speeches that significantly impacted the GBP/USD pair. Therefore, trying to explain the collapse by citing central bank speeches is just wishful thinking.
We still believe that the British pound will continue to rise based solely on one factor—the decline of the dollar. Naturally, if the global fundamental background starts shifting in favor of the US currency, the five-month upward trend may come to an end. But as of now, we see no signs of a reversal. From a technical perspective, if the pair consolidates below the Senkou Span B line, it would signal a continued downward correction, which is also possible.
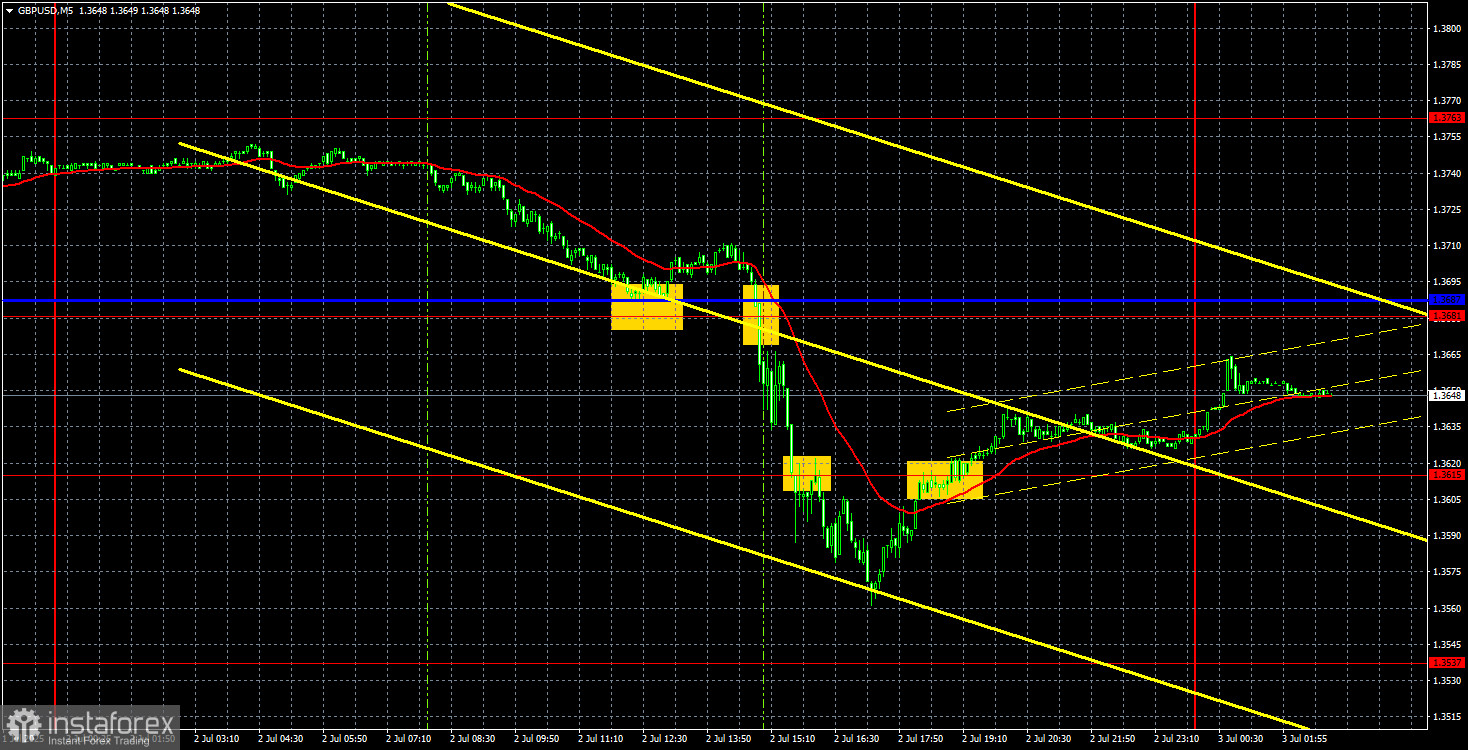
On the 5-minute timeframe, three trading signals were generated. The first buy signal around the critical line turned out to be false. At that point, the price was already plunging rapidly. We believe this was another manipulation—the market seemingly suggested the drop would be minor and short-lived, and that a rebound from the Kijun-sen line would end it. But in reality, the price continued to collapse, generating two sell signals that could have been executed as a single short position.
COT Report
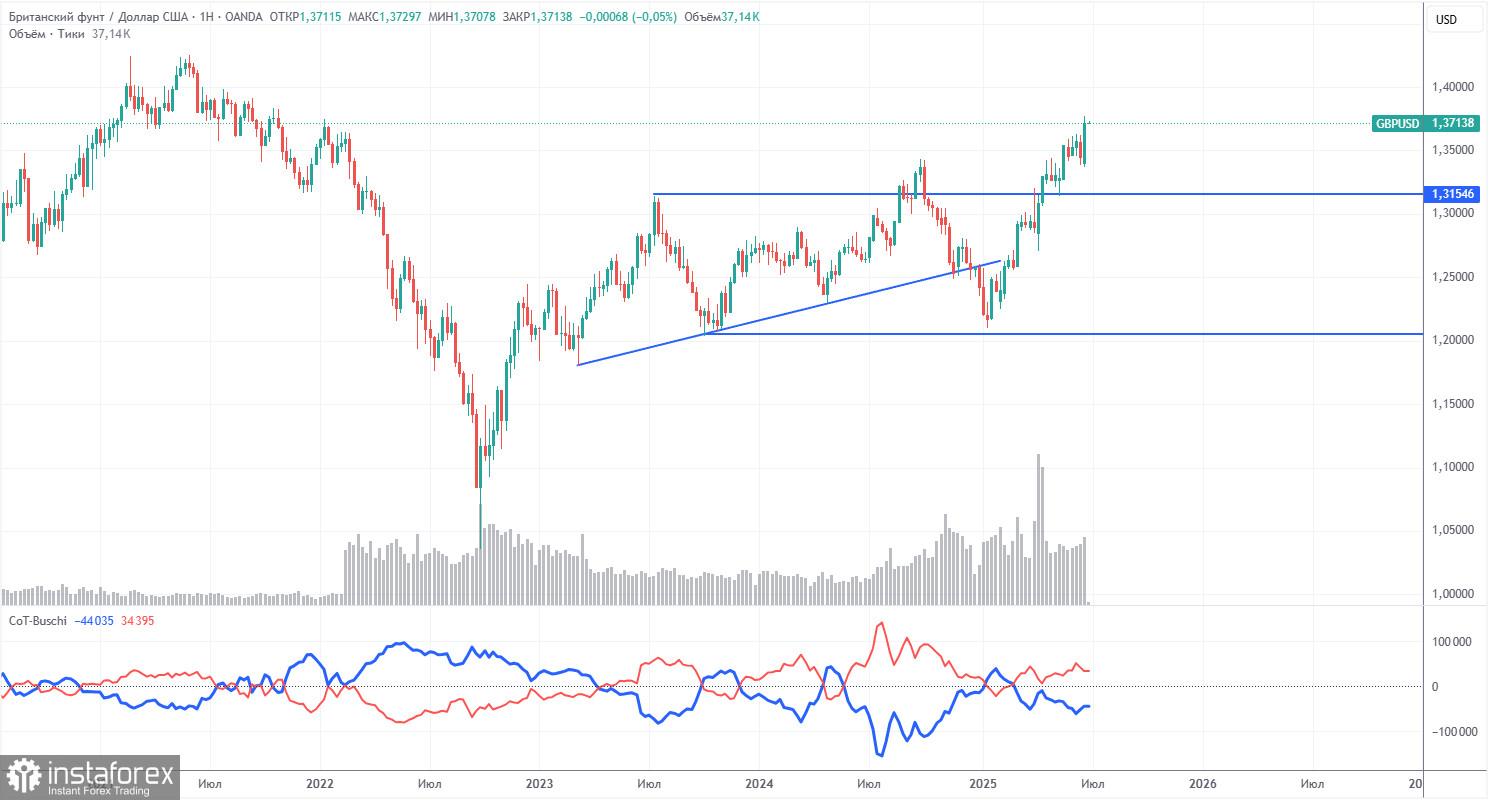
COT reports for the British pound indicate that commercial traders' sentiment has shifted constantly over the past few years. The red and blue lines, representing the net positions of commercial and non-commercial traders, frequently cross and typically remain near the zero line. Currently, they are also close to each other, indicating a roughly equal number of buy and sell positions. However, over the past year and a half, the net position has been increasing.
The dollar continues to weaken due to Trump's policies, making sterling demand among market makers less relevant at the moment. The trade war will continue in some form, and the Fed's key interest rate may drop significantly in the coming years — more than the economic outlook justifies. Thus, demand for the dollar will fall regardless. According to the latest COT report on the pound, the "Non-commercial" group closed 6,400 buy contracts and 2,000 sell contracts. This means the net position shrank by 8,400 contracts, but this carries virtually no significance.
In 2025, the pound has seen a sharp increase, but there's one main reason — Trump's policies. Once this factor fades, the dollar could start recovering. But when that happens, it is anyone's guess. Trump is only at the beginning of his presidency, and the next four years may bring many more shocks.
GBP/USD 1-Hour Analysis
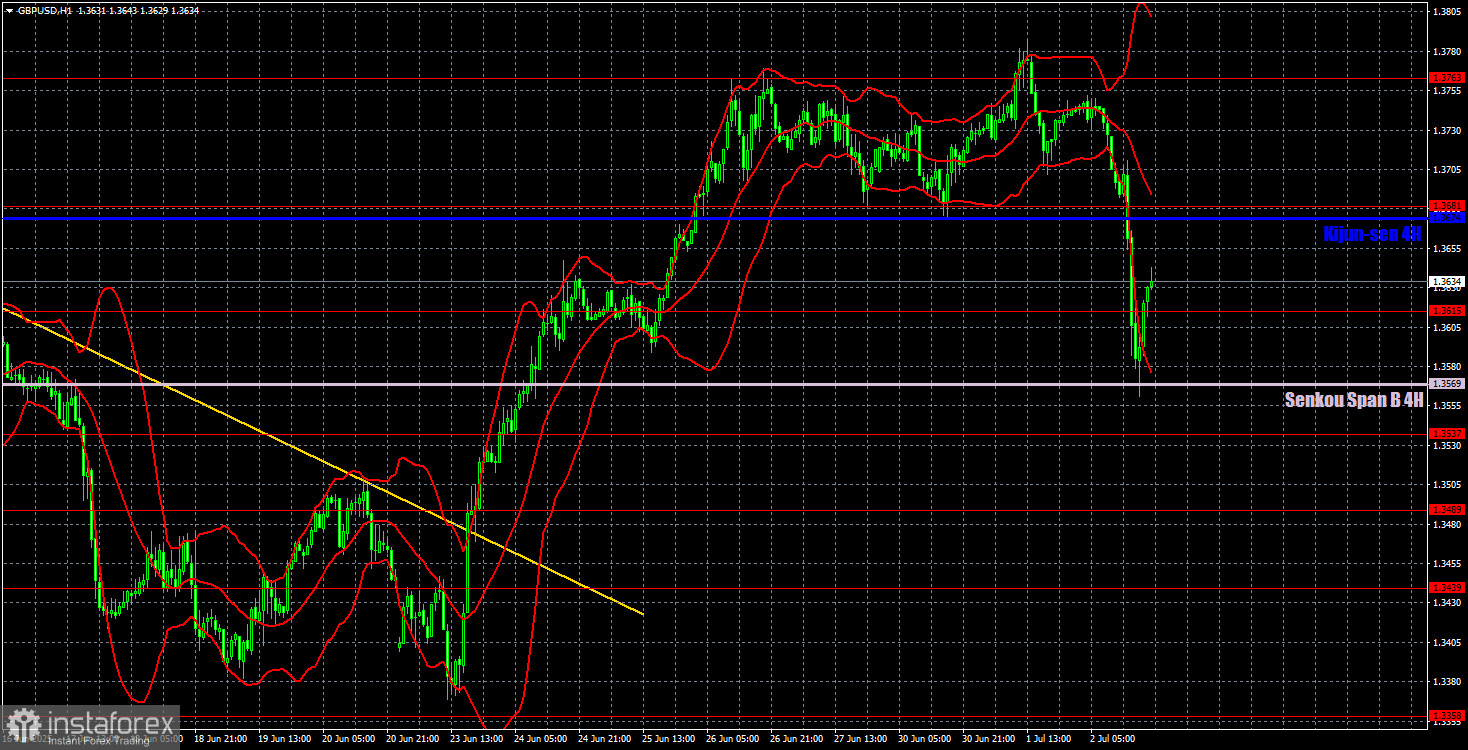
In the hourly timeframe, the GBP/USD pair dropped sharply, but there were no fundamental or macroeconomic reasons for it. Currently, the decline has halted around the Senkou Span B line, so the dollar's comeback may have already come to an end. Liquidity for buying has been collected, and the uptrend may resume. If the price consolidates below Senkou Span B, it would indicate that major players intend to push the pair lower.
We highlight the following important levels: 1.3212, 1.3288, 1.3358, 1.3439, 1.3489, 1.3537, 1.3615, 1.3741–1.3763, 1.3833, 1.3886. The Senkou Span B (1.3569) and Kijun-sen (1.3674) lines may also serve as signal sources. A Stop Loss should be set to breakeven after the price moves 20 pips in the correct direction. Note that the Ichimoku indicator lines can shift during the day, which should be considered when identifying trading signals.
On Thursday, the UK will release only the Services PMI, which is unlikely to generate serious interest. In the US, however, much more important data is scheduled: NonFarm Payrolls, the unemployment rate, and the ISM Services PMI.
Illustration Explanations:
- Support and resistance price levels – thick red lines where movement may end. They are not trading signal sources.
- Kijun-sen and Senkou Span B lines—These are strong Ichimoku indicator lines transferred to the hourly timeframe from the 4-hour one.
- Extremum levels – thin red lines where the price has previously rebounded. These act as trading signal sources.
- Yellow lines – trend lines, trend channels, and other technical patterns.
- COT Indicator 1 on the charts – the size of the net position for each category of traders.