

signal strength 2 of 5
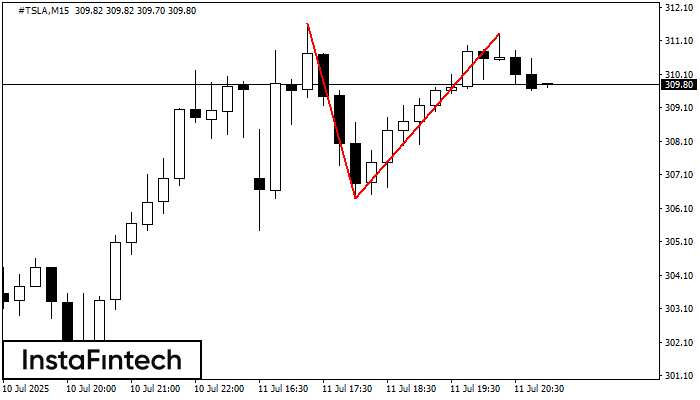
On the chart of #TSLA M15 the Double Top reversal pattern has been formed. Characteristics: the upper boundary 311.31; the lower boundary 306.40; the width of the pattern 491 points. The signal: a break of the lower boundary will cause continuation of the downward trend targeting the 306.17 level.
The M5 and M15 time frames may have more false entry points.
See Also
- All
- Double Top
- Flag
- Head and Shoulders
- Pennant
- Rectangle
- Triangle
- Triple top
- All
- #AAPL
- #AMZN
- #Bitcoin
- #EBAY
- #FB
- #GOOG
- #INTC
- #KO
- #MA
- #MCD
- #MSFT
- #NTDOY
- #PEP
- #TSLA
- #TWTR
- AUDCAD
- AUDCHF
- AUDJPY
- AUDUSD
- EURCAD
- EURCHF
- EURGBP
- EURJPY
- EURNZD
- EURRUB
- EURUSD
- GBPAUD
- GBPCHF
- GBPJPY
- GBPUSD
- GOLD
- NZDCAD
- NZDCHF
- NZDJPY
- NZDUSD
- SILVER
- USDCAD
- USDCHF
- USDJPY
- USDRUB
- All
- M5
- M15
- M30
- H1
- D1
- All
- Buy
- Sale
- All
- 1
- 2
- 3
- 4
- 5
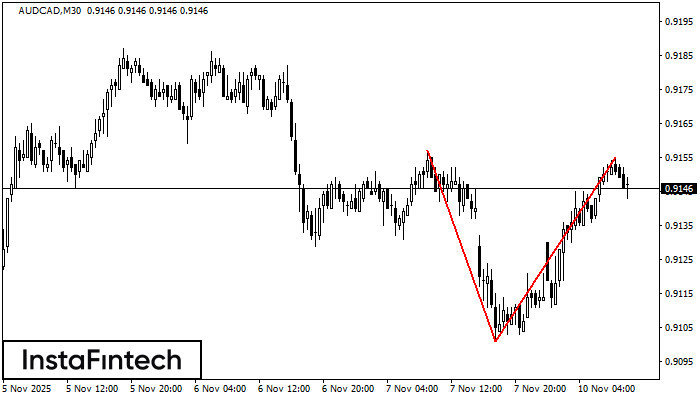
The Double Top reversal pattern has been formed on AUDCAD M30. Characteristics: the upper boundary 0.9157; the lower boundary 0.9101; the width of the pattern is 54 points. Sell trades
Open chart in a new window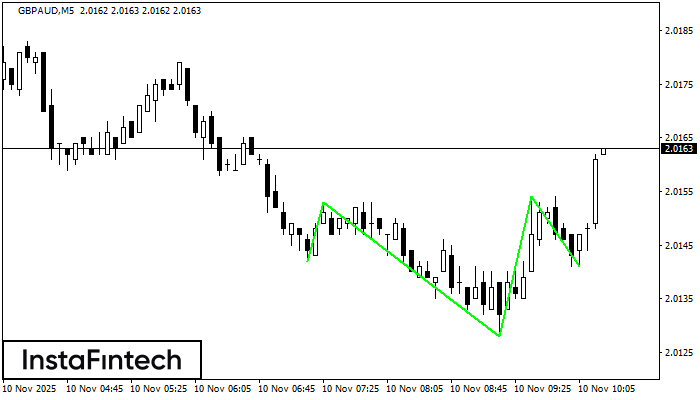
According to the chart of M5, GBPAUD formed the Inverse Head and Shoulder pattern. The Head’s top is set at 2.0154 while the median line of the Neck is found
The M5 and M15 time frames may have more false entry points.
Open chart in a new window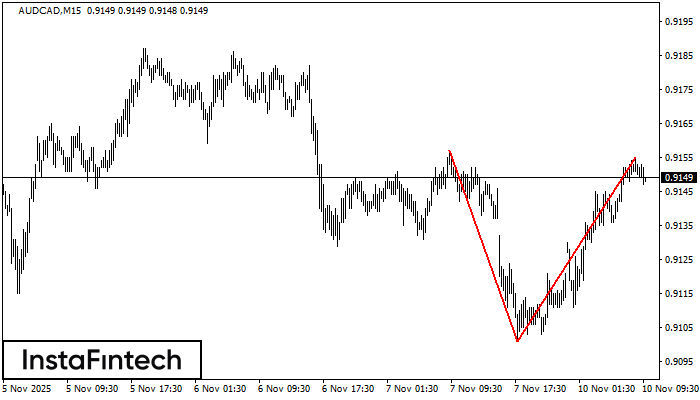
The Double Top pattern has been formed on AUDCAD M15. It signals that the trend has been changed from upwards to downwards. Probably, if the base of the pattern 0.9101
The M5 and M15 time frames may have more false entry points.
Open chart in a new window


