signal strength 2 of 5

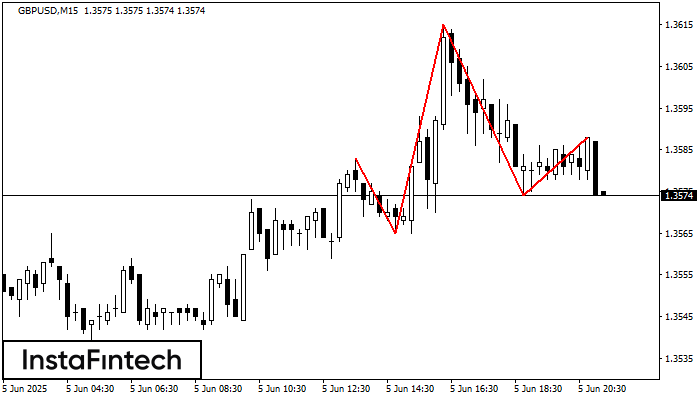
The technical pattern called Head and Shoulders has appeared on the chart of GBPUSD M15. There are weighty reasons to suggest that the price will surpass the Neckline 1.3565/1.3574 after the right shoulder has been formed. So, the trend is set to change with the price heading for 1.3551.
The M5 and M15 time frames may have more false entry points.
- All
- Double Top
- Flag
- Head and Shoulders
- Pennant
- Rectangle
- Triangle
- Triple top
- All
- #AAPL
- #AMZN
- #Bitcoin
- #EBAY
- #FB
- #GOOG
- #INTC
- #KO
- #MA
- #MCD
- #MSFT
- #NTDOY
- #PEP
- #TSLA
- #TWTR
- AUDCAD
- AUDCHF
- AUDJPY
- AUDUSD
- EURCAD
- EURCHF
- EURGBP
- EURJPY
- EURNZD
- EURRUB
- EURUSD
- GBPAUD
- GBPCHF
- GBPJPY
- GBPUSD
- GOLD
- NZDCAD
- NZDCHF
- NZDJPY
- NZDUSD
- SILVER
- USDCAD
- USDCHF
- USDJPY
- USDRUB
- All
- M5
- M15
- M30
- H1
- D1
- All
- Buy
- Sale
- All
- 1
- 2
- 3
- 4
- 5
According to the chart of M5, EURNZD formed the Bullish Symmetrical Triangle pattern. The lower border of the pattern touches the coordinates 1.9414/1.9424 whereas the upper border goes across 1.9431/1.9424
The M5 and M15 time frames may have more false entry points.
Open chart in a new windowThe Double Bottom pattern has been formed on EURUSD M15. This formation signals a reversal of the trend from downwards to upwards. The signal is that a buy trade should
The M5 and M15 time frames may have more false entry points.
Open chart in a new windowThe Double Bottom pattern has been formed on NZDUSD M5. Characteristics: the support level 0.6060; the resistance level 0.6067; the width of the pattern 7 points. If the resistance level
The M5 and M15 time frames may have more false entry points.
Open chart in a new window