


signal strength 1 of 5
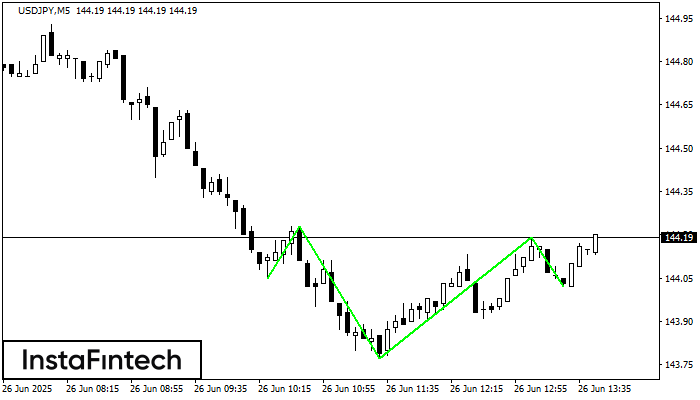
According to the chart of M5, USDJPY formed the Inverse Head and Shoulder pattern. The Head’s top is set at 144.19 while the median line of the Neck is found at 143.77/144.02. The formation of the Inverse Head and Shoulder pattern evidently signals a reversal of the downward trend. In other words, in case the scenario comes true, the price of USDJPY will go towards 144.34
The M5 and M15 time frames may have more false entry points.
See Also
- All
- Double Top
- Flag
- Head and Shoulders
- Pennant
- Rectangle
- Triangle
- Triple top
- All
- #AAPL
- #AMZN
- #Bitcoin
- #EBAY
- #FB
- #GOOG
- #INTC
- #KO
- #MA
- #MCD
- #MSFT
- #NTDOY
- #PEP
- #TSLA
- #TWTR
- AUDCAD
- AUDCHF
- AUDJPY
- AUDUSD
- EURCAD
- EURCHF
- EURGBP
- EURJPY
- EURNZD
- EURRUB
- EURUSD
- GBPAUD
- GBPCHF
- GBPJPY
- GBPUSD
- GOLD
- NZDCAD
- NZDCHF
- NZDJPY
- NZDUSD
- SILVER
- USDCAD
- USDCHF
- USDJPY
- USDRUB
- All
- M5
- M15
- M30
- H1
- D1
- All
- Buy
- Sale
- All
- 1
- 2
- 3
- 4
- 5
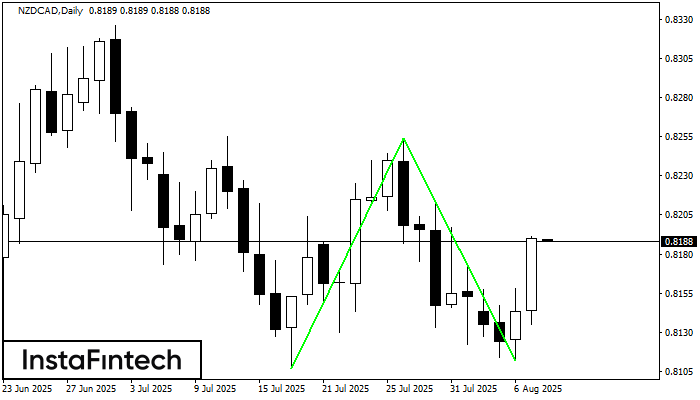
El patrón Doble Piso ha sido formado en NZDCAD D1; el límite superior es 0.8254; el límite inferior es 0.8112. El ancho del patrón es 147 puntos. En caso
Open chart in a new window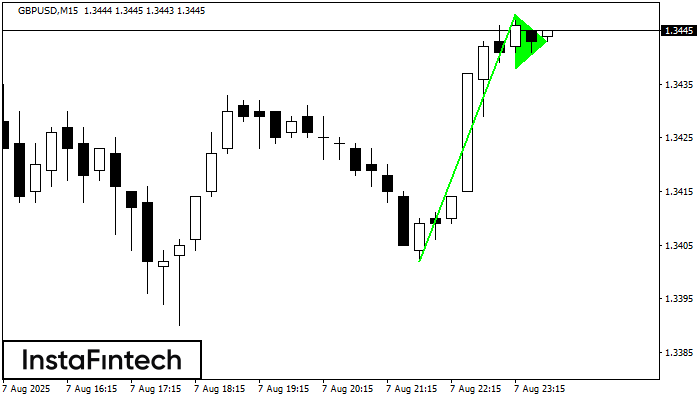
La señal Banderín alcista – Instrumento de negociación GBPUSD M15, patrón de continuación. Pronóstico: es posible establecer una posición de compra por encima del alza del patrón de 1.3448
Los marcos de tiempo M5 y M15 pueden tener más puntos de entrada falsos.
Open chart in a new window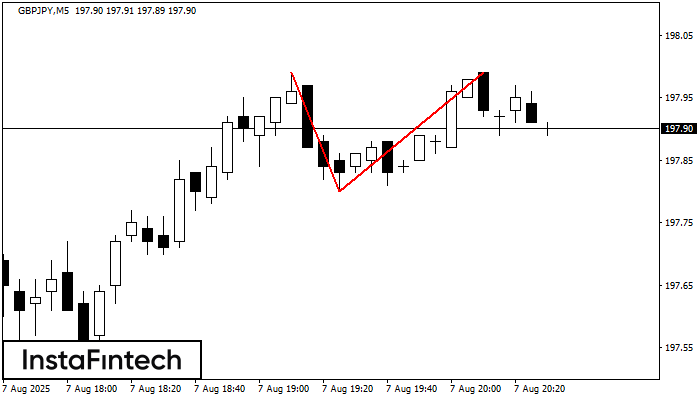
En el gráfico de GBPJPY M5 el patrón de reversión Doble Techo ha sido formado. Características: límite superior 197.99; límite inferior 197.80; el ancho del patrón 19 puntos. La señal
Los marcos de tiempo M5 y M15 pueden tener más puntos de entrada falsos.
Open chart in a new window


