


signal strength 2 of 5
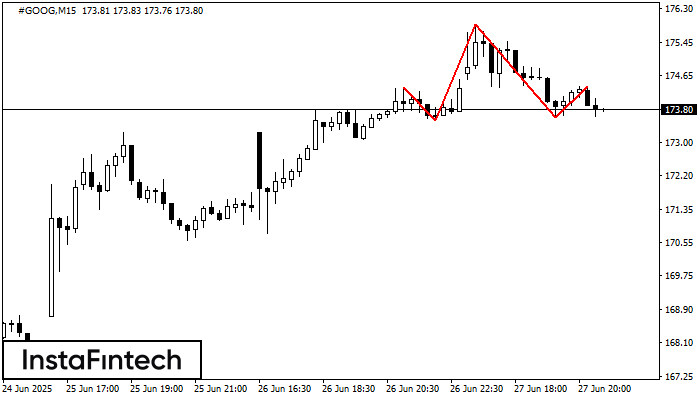
According to the chart of M15, #GOOG formed the Head and Shoulders pattern. The Head’s top is set at 175.90 while the median line of the Neck is found at 173.53/173.62. The formation of the Head and Shoulders pattern evidently signals a reversal of the upward trend. In other words, in case the scenario comes true, the price of #GOOG will go towards 173.40.
The M5 and M15 time frames may have more false entry points.
See Also
- All
- Double Top
- Flag
- Head and Shoulders
- Pennant
- Rectangle
- Triangle
- Triple top
- All
- #AAPL
- #AMZN
- #Bitcoin
- #EBAY
- #FB
- #GOOG
- #INTC
- #KO
- #MA
- #MCD
- #MSFT
- #NTDOY
- #PEP
- #TSLA
- #TWTR
- AUDCAD
- AUDCHF
- AUDJPY
- AUDUSD
- EURCAD
- EURCHF
- EURGBP
- EURJPY
- EURNZD
- EURRUB
- EURUSD
- GBPAUD
- GBPCHF
- GBPJPY
- GBPUSD
- GOLD
- NZDCAD
- NZDCHF
- NZDJPY
- NZDUSD
- SILVER
- USDCAD
- USDCHF
- USDJPY
- USDRUB
- All
- M5
- M15
- M30
- H1
- D1
- All
- Buy
- Sale
- All
- 1
- 2
- 3
- 4
- 5
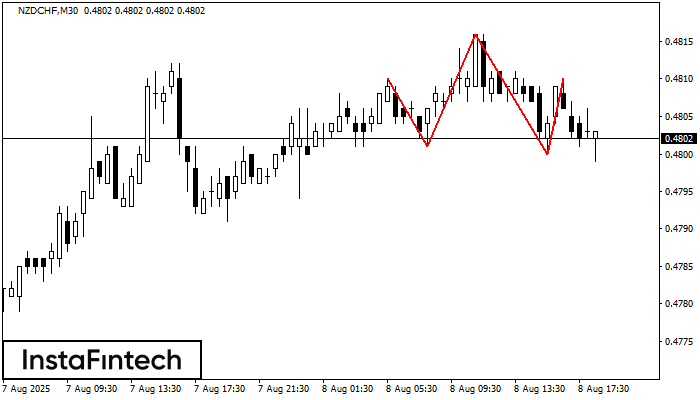
The NZDCHF M30 formed the Head and Shoulders pattern with the following features: The Head’s top is at 0.4816, the Neckline and the upward angle are at 0.4801/0.4800. The formation
Open chart in a new window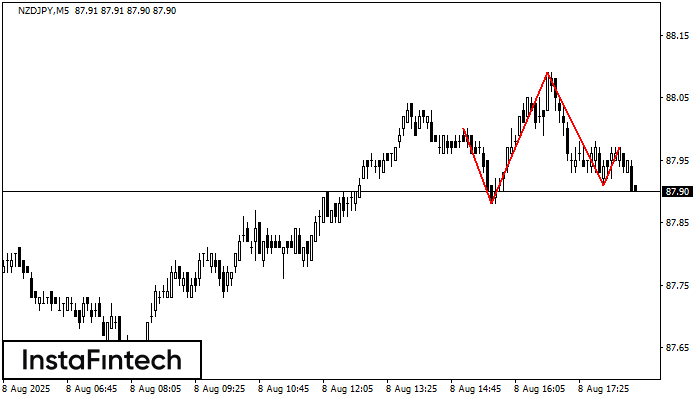
The NZDJPY M5 formed the Head and Shoulders pattern with the following features: The Head’s top is at 88.09, the Neckline and the upward angle are at 87.88/87.91. The formation
The M5 and M15 time frames may have more false entry points.
Open chart in a new window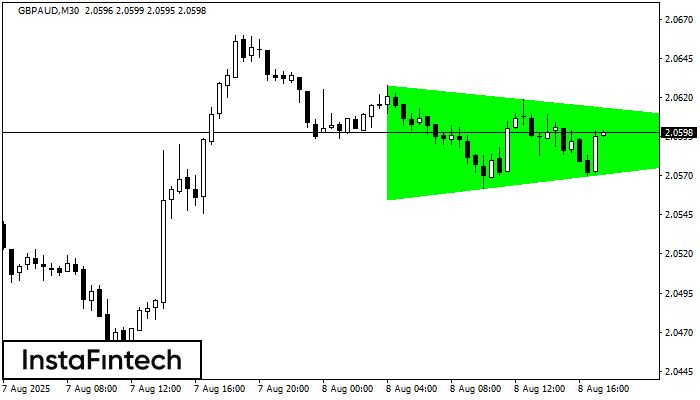
According to the chart of M30, GBPAUD formed the Bullish Symmetrical Triangle pattern. The lower border of the pattern touches the coordinates 2.0555/2.0594 whereas the upper border goes across 2.0628/2.0594
Open chart in a new window


