signal strength 1 of 5
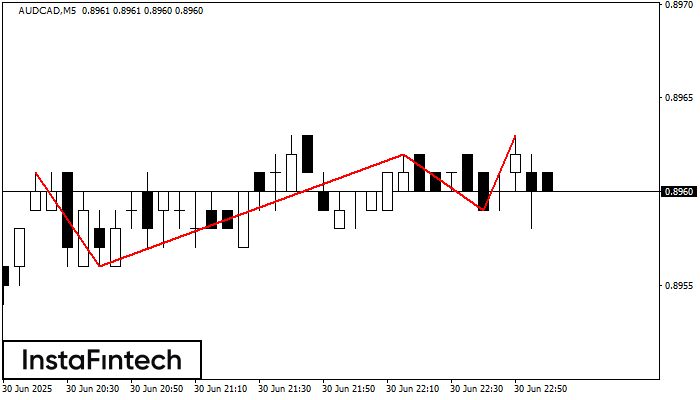
The Triple Top pattern has formed on the chart of the AUDCAD M5 trading instrument. It is a reversal pattern featuring the following characteristics: resistance level -2, support level -3, and pattern’s width 5. Forecast If the price breaks through the support level 0.8956, it is likely to move further down to 0.8947.
The M5 and M15 time frames may have more false entry points.
See Also
- All
- Double Top
- Flag
- Head and Shoulders
- Pennant
- Rectangle
- Triangle
- Triple top
- All
- #AAPL
- #AMZN
- #Bitcoin
- #EBAY
- #FB
- #GOOG
- #INTC
- #KO
- #MA
- #MCD
- #MSFT
- #NTDOY
- #PEP
- #TSLA
- #TWTR
- AUDCAD
- AUDCHF
- AUDJPY
- AUDUSD
- EURCAD
- EURCHF
- EURGBP
- EURJPY
- EURNZD
- EURRUB
- EURUSD
- GBPAUD
- GBPCHF
- GBPJPY
- GBPUSD
- GOLD
- NZDCAD
- NZDCHF
- NZDJPY
- NZDUSD
- SILVER
- USDCAD
- USDCHF
- USDJPY
- USDRUB
- All
- M5
- M15
- M30
- H1
- D1
- All
- Buy
- Sale
- All
- 1
- 2
- 3
- 4
- 5
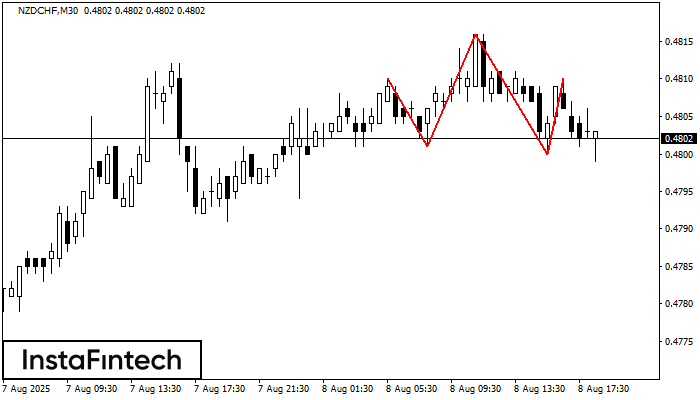
El NZDCHF M30 formó el patrón Cabeza y Hombros con las siguientes características: El techo de la Cabeza se encuentra en 0.4816, la línea de cuello y el ángulo alcista
Open chart in a new window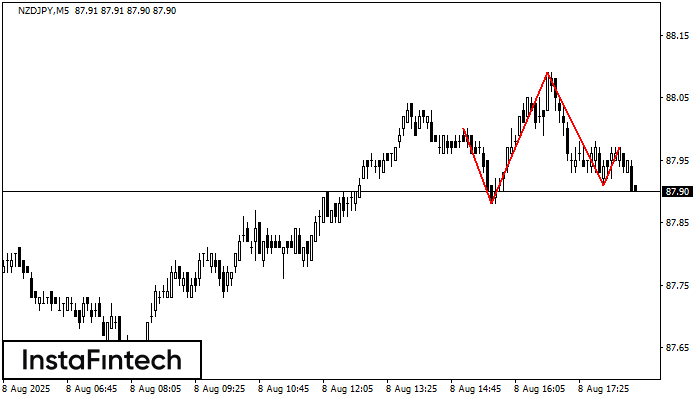
El NZDJPY M5 formó el patrón Cabeza y Hombros con las siguientes características: El techo de la Cabeza se encuentra en 88.09, la línea de cuello y el ángulo alcista
Los marcos de tiempo M5 y M15 pueden tener más puntos de entrada falsos.
Open chart in a new window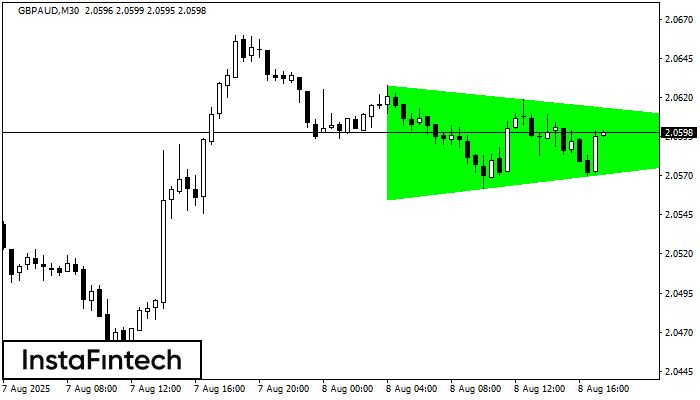
Según el gráfico de M30, el GBPAUD formó el patrón Triángulo Simétrico Alcista. El límite inferior del patrón toca las coordenadas 2.0555/2.0594 donde el límite superior cruza 2.0628/2.0594
Open chart in a new window