


signal strength 3 of 5
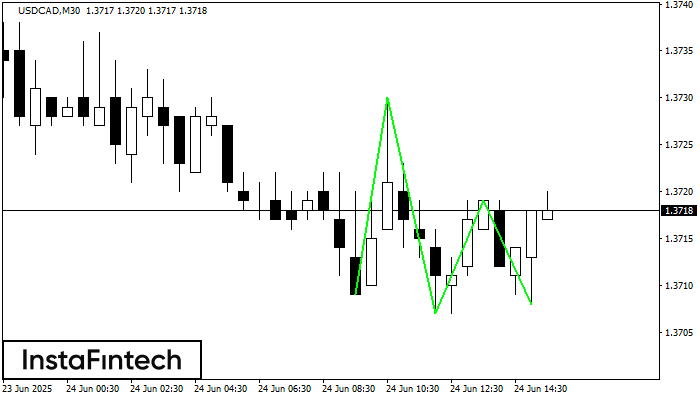
The Triple Bottom pattern has formed on the chart of USDCAD M30. Features of the pattern: The lower line of the pattern has coordinates 1.3730 with the upper limit 1.3730/1.3719, the projection of the width is 21 points. The formation of the Triple Bottom pattern most likely indicates a change in the trend from downward to upward. This means that in the event of a breakdown of the resistance level 1.3709, the price is most likely to continue the upward movement.
- All
- Double Top
- Flag
- Head and Shoulders
- Pennant
- Rectangle
- Triangle
- Triple top
- All
- #AAPL
- #AMZN
- #Bitcoin
- #EBAY
- #FB
- #GOOG
- #INTC
- #KO
- #MA
- #MCD
- #MSFT
- #NTDOY
- #PEP
- #TSLA
- #TWTR
- AUDCAD
- AUDCHF
- AUDJPY
- AUDUSD
- EURCAD
- EURCHF
- EURGBP
- EURJPY
- EURNZD
- EURRUB
- EURUSD
- GBPAUD
- GBPCHF
- GBPJPY
- GBPUSD
- GOLD
- NZDCAD
- NZDCHF
- NZDJPY
- NZDUSD
- SILVER
- USDCAD
- USDCHF
- USDJPY
- USDRUB
- All
- M5
- M15
- M30
- H1
- D1
- All
- Buy
- Sale
- All
- 1
- 2
- 3
- 4
- 5
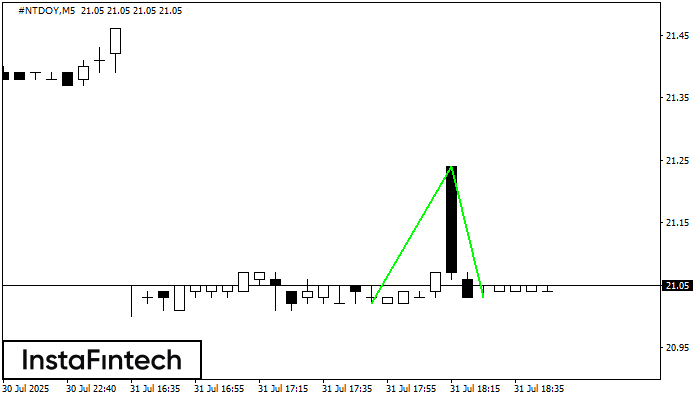
O padrão Fundo duplo foi formado em #NTDOY M5. Características: o nível de suporte 21.02; o nível de resistência 21.24; a largura do padrão 22 pontos. Se o nível
Os intervalos M5 e M15 podem ter mais pontos de entrada falsos.
Open chart in a new window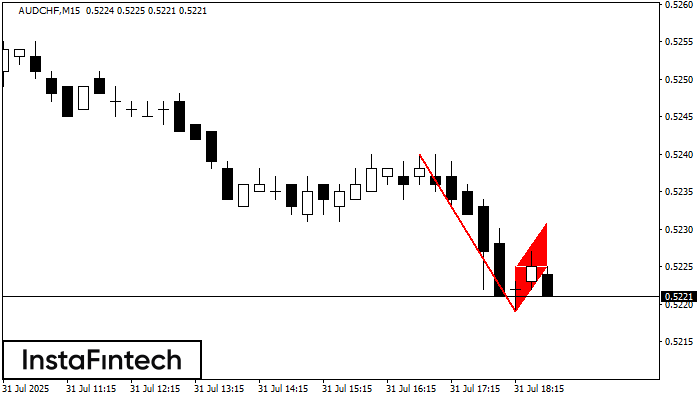
O padrão Bandeira de Baixa foi formado no gráfico AUDCHF M15. Portanto, é provável que a tendência de queda continue a curto prazo. Assim que o preço cair abaixo
Os intervalos M5 e M15 podem ter mais pontos de entrada falsos.
Open chart in a new window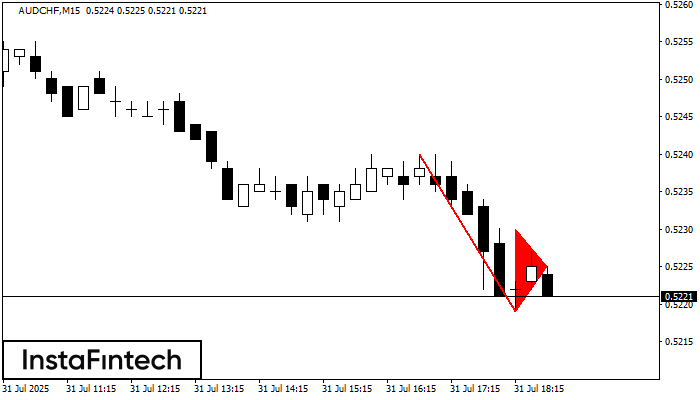
O padrão Pennant de baixa foi formado no gráfico AUDCHF M15. O padrão sinaliza a continuação da tendência de baixa caso o pennant de baixa de 0.5219 for quebrada. Recomendações
Os intervalos M5 e M15 podem ter mais pontos de entrada falsos.
Open chart in a new window


