Analysis of Trades and Trading Tips for the British Pound
The price test at 1.3494 occurred when the MACD indicator moved significantly above the zero mark, limiting the pair's upside potential. For this reason, I did not buy the pound.
U.S. data matched economists' forecasts, keeping GBP/USD trading within a sideways channel. The lack of surprises in macroeconomic data provided no impetus for the pound to rise or fall against the U.S. dollar. Traders took a wait-and-see approach, awaiting clearer signals regarding future monetary policy decisions from the Federal Reserve and the Bank of England. Today, market sentiment remains cautious as investors assess risks related to inflation, economic growth, and geopolitical tensions. Uncertainty about the global economic outlook, especially following recent statements from White House officials, is curbing trading activity and contributing to range-bound consolidation.
Today, important figures are expected for the UK: the manufacturing PMI, the number of approved mortgage applications, and the volume of net lending to individuals. These figures will serve as important indicators of the state of the British economy, allowing an assessment of its resilience in the face of global challenges and inflationary pressures.
- The manufacturing PMI reflects business sentiment and expectations for the future. A figure above 50 indicates growth, while below 50 signals contraction.
- The number of approved mortgage applications is an important indicator of the housing market's health. Growth suggests increased housing demand and consumer willingness to take on long-term financial commitments, while a decline signals caution among potential buyers.
- Finally, net lending to individuals reflects consumer activity and confidence in the future. Increased lending may point to rising consumer spending and economic stimulus.
For intraday strategy, I will focus primarily on Scenarios #1 and #2.
Buy Scenario
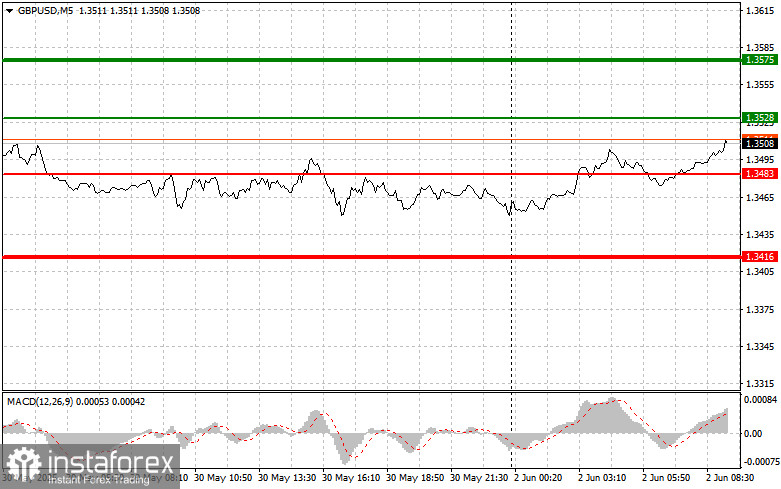
Scenario #1: Today, I plan to buy the pound when the entry point reaches around 1.3528 (green line on the chart), targeting growth to the level of 1.3575 (thicker green line on the chart). Around 1.3575, I plan to exit purchases and open sales in the opposite direction (targeting a 30–35 pip move in the opposite direction from the entry point). Counting on a strong pound rally is only possible after good data.
Important! Before buying, ensure the MACD indicator is above the zero mark and is just beginning to rise.
Scenario #2: I also plan to buy the pound today in case of two consecutive tests of the 1.3483 price level when the MACD indicator is in the oversold area. This will limit the pair's downside potential and lead to an upward market reversal. Growth to the opposite levels of 1.3528 and 1.3575 can be expected.
Sell Scenario
Scenario #1: Today, I plan to sell the pound after breaking below the 1.3483 level (red line on the chart), leading to a quick decline of the pair. The sellers' key target will be the 1.3416 level, where I plan to exit sales and immediately open buys in the opposite direction (targeting a 20–25 pip move in the opposite direction from the level). Selling the pound is possible after an unsuccessful attempt to break above the daily high.
Important! Before selling, ensure the MACD indicator is below the zero mark and is just beginning its decline.
Scenario #2: I also plan to sell the pound today in case of two consecutive tests of the 1.3528 price level when the MACD indicator is in the overbought area. This will limit the pair's upward potential and lead to a market reversal downward. A decline to the opposite levels of 1.3483 and 1.3416 can be expected.
What's on the Chart:
- The thin green line represents the entry price where the trading instrument can be bought.
- The thick green line indicates the expected price level where a Take Profit order can be placed, or profits can be manually secured, as further price growth above this level is unlikely.
- The thin red line represents the entry price where the trading instrument can be sold.
- The thick red line indicates the expected price level where a Take Profit order can be placed, or profits can be manually secured, as further price decline below this level is unlikely.
- The MACD indicator should be used to assess overbought and oversold zones when entering the market.
Important Notes:
- Beginner Forex traders should exercise extreme caution when making market entry decisions. It is advisable to stay out of the market before the release of important fundamental reports to avoid exposure to sharp price fluctuations. If you choose to trade during news releases, always use stop-loss orders to minimize potential losses. Trading without stop-loss orders can quickly wipe out your entire deposit, especially if you neglect money management principles and trade with high volumes.
- Remember, successful trading requires a well-defined trading plan, similar to the one outlined above. Making impulsive trading decisions based on the current market situation is a losing strategy for intraday traders.