Analysis of Trades and Trading Tips for the Japanese Yen
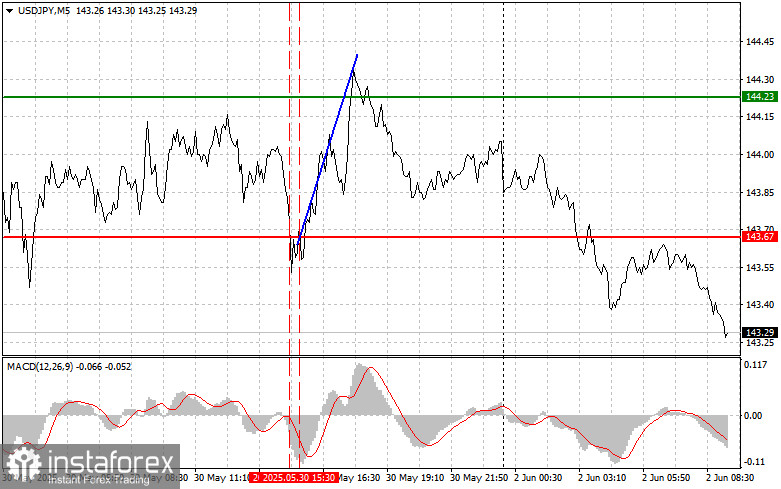
The price test at 143.67 occurred when the MACD indicator had already moved significantly below the zero line, limiting the pair's downside potential. For this reason, I did not sell the dollar. The second test at 143.67 coincided with the MACD being in the oversold area, confirming the correct entry point for buying the dollar, which resulted in a 50-pip gain.
On Friday, after statements from U.S. administration officials about a renewed stall in trade negotiations with China, the dollar came under pressure. Investors' fears of a possible escalation in the trade conflict between the world's two largest economies intensified, leading to a natural flow of capital into safe-haven assets. Breakdowns in trade talks increase uncertainty about the future economic outlook for the U.S. Many economists are already pointing to a slowdown in economic growth, and further escalation of trade tensions could worsen the situation.
Good data from Japan's manufacturing PMI, which approached the 50-point mark, supported the yen today and increased pressure on the dollar. Although this unexpected uptick did not reach expansion territory, it indicates a gradual recovery in Japan's industrial sector, inspiring optimism about the country's economic prospects. A rise in the manufacturing PMI may signal increased orders, production, and employment in Japan's manufacturing sector, thereby strengthening the yen as investors see it as a sign of improving economic conditions and the growing attractiveness of Japanese assets. However, the economic situation remains dynamic, and the future of the yen and the dollar will depend on many factors, including global economic trends, political events, and decisions by central banks. Investors should carefully monitor incoming information and consider various scenarios when making investment decisions.
For intraday strategy, I will focus primarily on implementing Scenarios #1 and #2.
Buy Scenario
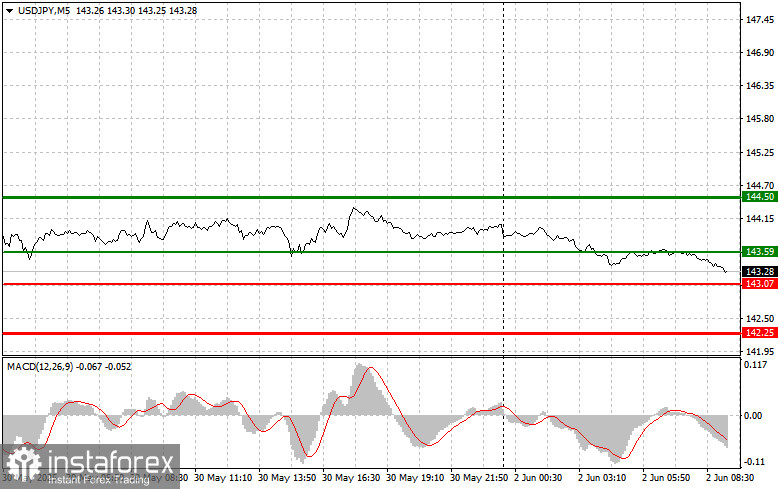
Scenario #1: Today, I plan to buy USD/JPY when the entry point reaches around 143.59 (green line on the chart), targeting a rise to 144.50 (thicker green line on the chart). Around 144.50, I plan to exit buys and open sells in the opposite direction (targeting a 30–35 pip move in the opposite direction from the entry point). It's best to return to buying the pair on corrections and significant pullbacks in USD/JPY.
Important! Before buying, ensure the MACD indicator is above the zero line and is just beginning to rise.
Scenario #2: I also plan to buy USD/JPY today in case of two consecutive tests of the 143.07 price level when the MACD indicator is in the oversold area. This will limit the pair's downside potential and lead to an upward market reversal. A rise to the opposite levels of 143.59 and 144.50 can be expected.
Sell Scenario
Scenario #1: Today, I plan to sell USD/JPY only after breaking below the 143.07 level (red line on the chart), which will lead to a quick decline of the pair. The sellers' key target will be 142.25, where I plan to exit sales and immediately open buys in the opposite direction (targeting a 20–25 pip move in the opposite direction from the level). Pressure on the pair may persist today.
Important! Before selling, ensure the MACD indicator is below the zero line and is just beginning its decline.
Scenario #2: I also plan to sell USD/JPY today in case of two consecutive tests of the 143.59 price level when the MACD indicator is in the overbought area. This will limit the pair's upward potential and lead to a market reversal downward. A decline to the opposite levels of 143.07 and 142.25 can be expected.
What's on the Chart:
- The thin green line represents the entry price where the trading instrument can be bought.
- The thick green line indicates the expected price level where a Take Profit order can be placed, or profits can be manually secured, as further price growth above this level is unlikely.
- The thin red line represents the entry price where the trading instrument can be sold.
- The thick red line indicates the expected price level where a Take Profit order can be placed, or profits can be manually secured, as further price decline below this level is unlikely.
- The MACD indicator should be used to assess overbought and oversold zones when entering the market.
Important Notes:
- Beginner Forex traders should exercise extreme caution when making market entry decisions. It is advisable to stay out of the market before the release of important fundamental reports to avoid exposure to sharp price fluctuations. If you choose to trade during news releases, always use stop-loss orders to minimize potential losses. Trading without stop-loss orders can quickly wipe out your entire deposit, especially if you neglect money management principles and trade with high volumes.
- Remember, successful trading requires a well-defined trading plan, similar to the one outlined above. Making impulsive trading decisions based on the current market situation is a losing strategy for intraday traders.