empty
08.02.2023 08:17 PM
Technical analysis of EUR/USD for February 08, 2023

This image is no longer relevant

Overview:

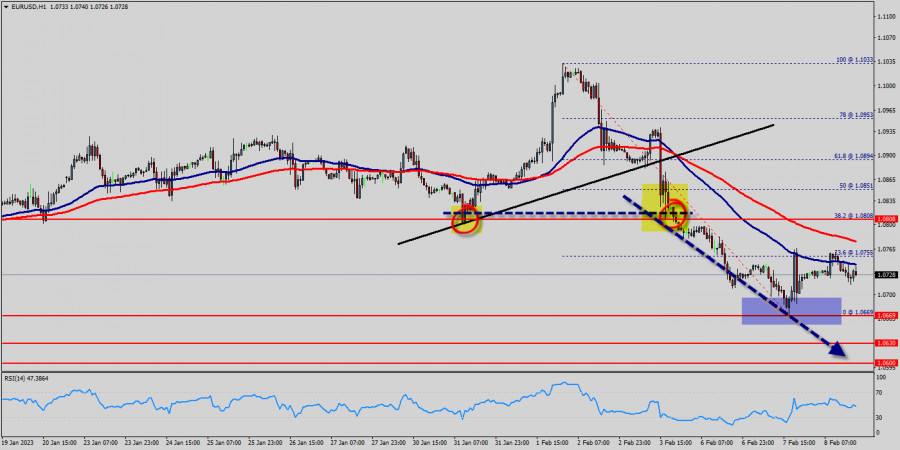
The EUR/USD pair has faced strong resistances at the levels of 1.0880 because support had become resistance last week. So, the strong resistance has been already formed at the level of 1.0880 and the pair is likely to try to approach it in order to test it again. However, if the pair fails to pass through the level of 1.0880, the market will indicate a bearish opportunity below the new strong resistance level of 1.0880 (the level of 1.0880 coincides with a ratio of 38.2% Fibonacci - last bullish wave - double top).

Moreover, the RSI starts signaling a downward trend, as the trend is still showing strength above the moving average (100) and (50). The trend of EUR/USD pair movement was controversial as it took place in the downtrend channel.

Due to the previous events, the price is still set between the levels of 1.0808 and 1.0669, so it is recommended to be careful while making deals in these levels because the prices of 1.0808 and 1.0669 are representing the resistance and support respectively.

Therefore, it is necessary to wait till the downtrend channel is passed through. Then the market will probably show the signs of a bearish market.

It should be noted that the volatility is very high for that the price of the EUR/USD pair is still trading between the prices of 1.0669 and 1.0808 in the coming hours.

Furthermore, the price has been set below the strong resistance at the levels of 1.0808 and 1.0851 which coincide with the 38.2% and 50% Fibonacci retracement levels respectively.

Thus, the market is indicating a bearish opportunity below 1.0808 so it will be good to sell at 1.0808 with the first target of 1.0669.

It will also call for a downtrend in order to continue towards 1.0630. The daily strong support is seen at 1.0600.

However, the stop loss should always be taken into account, for that it will be reasonable to set your stop loss at the level of 1.0851.

Moving averages, in the meantime, maintain their bearish slope way above the current level. Furthermore, although the news is bearish for the EUR/USD pair, professional may not want to sell weakness, but rather following a rebound rally.

Additionally, some aggressive counter-trend buyers may be defending parity. In case a continuousion takes place and the EUR/USD pair breaks through the support level of 1.0669 , a further decline to 1.0600 can occur which would indicate a bearish market.

Signal :

It should be noted that the 1.0808 price will act as a major resistance on Feb. 08th, 2023. Therefore, it will be too gainful to sell short below 1.0808 and look for further downside with 1.0669, 1.0630 and 1.0600 targets. It should also be reminded that stop loss must never exceed the maximum exposure amounts. Thus, stop loss should be placed at the 1.0851 level today.

เลือกช่วงเวลา
5
นาที
15
นาที
30
นาที
1
ชั่วโมง
4
ชั่วโมง
1
วัน
1
สัปดาห์
รับผลกำไรจากการเปลี่ยนแปลงอัตราสกุลเงินดิจิทัลกับ InstaForex.
ดาวน์โหลด MetaTrader 4 และเปิดการซื้อขายครั้งแรกของคุณ.
  • Grand Choice
    Contest by
    InstaForex
    InstaForex always strives to help you
    fulfill your biggest dreams.
    เข้าร่วมการแข่งขัน


บทความแนะนำ

NZD/USD. การวิเคราะห์, การพยากรณ์, และสถานการณ์ตลาดปัจจุบัน

คู่สกุลเงิน NZD/USD ในปัจจุบันทำการซื้อขายอยู่เหนือระดับทางจิตวิทยาที่ 0.6000; แต่ก็ยังยุ่งเหยิงต่อภัยความเสื่อมที่สงวนไว้จากความแข็งแกร่งของสกุลเงินดอลลาร์สหรัฐทั่วไป. ดัชนีสกุลเงินดอลลาร์สหรัฐได้รับการสนับสนุนจากความคาดหวังว่าอัตราภาษีสูงขึ้นของสหรัฐจะเพิ่มแรงกดดันในฝันลมที่เกิดขึ้นจากเงินเฟ้อและสร้างความรอแรงในการทำงานขององค์การสงวนฯ นอกจากนี้ ความกังวลเรื่องผลกระทบทางเศรษฐกิจจากนโยบายการค้าของสหรัฐยังส่งผลกระทบต่ออารมณ์ของนักลงทุน ซึ่งเสริมสร้างความแข็งแกร่งของดอลลาร์สหรัฐในฐานะทรัพย์สินปลอดภัยและทำให้สกุลเงินที่มีความเสี่ยงเป็นที่ต้องการ, รวมถึงดอลลาร์นิวซีแลนด์. จากมุมมองทางเทคนิค, การที่คู่สกุลเงิน NZD/USD หักต่ำกว่าเฉลี่ยเคลื่อนที่ง่าย (SMA)

Irina Yanina 12:00 2025-07-09 UTC+2

การพยากรณ์ราคาคู่สกุลเงิน EUR/USD ในวันที่ 9 กรกฎาคม 2025

ในวันอังคาร, คู่ EUR/USD ยังคงมีแนวโน้มลดลง, โดยที่ไม่ได้คำนึงถึงระดับการแก้ไข 127.2% ที่ 1.1712 เลย. ในปัจจุบันระดับนี้ไม่เหมาะสมสำหรับการระบุสัญญาณการซื้อขาย. การลดตัวของยูโรควรถูกมองว่าเป็นการถอยกลับแบบส่งเสริมการแก้ไข. โครงสร้างของคลื่นบนชาร์ตรายชั่วโมงยังคงเป็นที่สะอาดและชัดเจน คลื่นขาขึ้นล่าสุดที่สมบูรณ์แตกมาจากยอดของคลื่นก่อนหน้า ในขณะที่คลื่นขาลงใหม่ไม่ได้เข้ามาใกล้กับเกณฑ์ต่ำก่อนหน้า ดังนั้นแนวโน้มยังคงเป็นแบบขาขึ้น

Samir Klishi 11:14 2025-07-09 UTC+2

การคาดการณ์สำหรับ GBP/USD ในวันที่ 9 กรกฎาคม 2025

ในกราฟรายชั่วโมง คู่สกุลเงิน GBP/USD ร่วงลงมาถึงระดับ 127.2% ของ Fibonacci ที่ 1.3527 เมื่อวันอังคาร จากนั้นฟื้นตัวขึ้นและสนับสนุนฝั่งปอนด์ ซึ่งอาจเป็นสัญญาณยุติการเคลื่อนไหวขาลงในช่วงที่ผ่านมา วันนี้ ราคามีโอกาสที่จะเติบโตขึ้นไปยังโซนแนวต้านที่ 1.3611–1.3633

Samir Klishi 11:05 2025-07-09 UTC+2

ระดับ 0.7939 จะสามารถรับมือกับการปรับฐานชั่วคราวของคู่เงิน USD/CHF ในวันพุธที่ 9 กรกฎาคม 2025 ได้หรือไม่?

USD/CHF – วันพุธที่ 9 กรกฎาคม 2025 เนื่องจากการสนับสนุนในการเป็นสินทรัพย์ปลอดภัยของ USD และความเสี่ยงในระดับการค้าระดับโลก แม้ว่า CHF จะค่อนข้างแข็งแกร่ง แต่สภาวะเหล่านี้ยังมีโอกาสที่ USD/CHF จะกลับมาแข็งค่าขึ้นอีกครั้ง

Arief Makmur 07:12 2025-07-09 UTC+2

ผู้ขายยังคงครอบงำคู่เงินสกุลสินค้าโภคภัณฑ์ NZD/USD ในวันพุธที่ 9 กรกฎาคม 2025

NZD/USD, วันพุธที่ 9 กรกฎาคม 2025 บรรยากาศความเสี่ยงของตลาดโลกเกี่ยวกับค่าเงินสินค้าโภคภัณฑ์และแนวโน้มทางการเงินที่ระมัดระวังของนิวซีแลนด์กำลังกดดันศักยภาพของค่าเงินคีวีในวันนี้ ระดับสำคัญ 1. แนวต้าน 2 : 0.6054 2. แนวต้าน

Arief Makmur 07:12 2025-07-09 UTC+2

การพยากรณ์ค่าเงิน EUR/USD สำหรับวันที่ 9 กรกฎาคม 2025

ในวันอังคาร ยูโรพยายามเคลื่อนตัวลงแต่ไม่สามารถไปถึงแนวรับที่ MACD line โดยหยุดที่ระดับเป้าหมายที่ 1.1692 วันปิดด้วยแท่งเทียนสีขาว ซึ่งเพิ่มความเป็นไปได้ที่ราคาจะรีบาวด์กลับไปทดสอบขอบเขตบนของช่องราคาที่ 1.1830 สำหรับการปรับตัวลงต่อไป ราคาจะต้องลงต่ำกว่าระดับแนวรับที่ถึงเมื่อวานและต่ำกว่าระดับเส้น MACD ด้วย อย่างไรก็ตาม สิ่งนี้จำเป็นต้องมีเวลาอย่างน้อยอีกสองวัน

Laurie Bailey 06:58 2025-07-09 UTC+2

การคาดการณ์ GBP/USD สำหรับวันที่ 9 กรกฎาคม 2025

เมื่อวานนี้ ปอนด์อังกฤษได้ทดสอบบริเวณรอบเส้นสมดุลรายวัน การเคลื่อนไหวนี้แสดงถึงความอ่อนแอของระดับแนวรับในเส้นทางสู่ระดับเป้าหมายที่ 1.3414 ซึ่งได้รับการยืนยันจากออสซิลเลเตอร์ Marlin ที่ค่อย ๆ ลดลงในพื้นที่ลบ อย่างไรก็ตาม ราคายังไม่ได้ก้าวต่อไปเพื่อทดสอบระดับกลางที่ 1.3510 ซึ่งน่าจะเป็นผลจากการรอคอยข้อมูล GDP และข้อมูลการผลิตอุตสาหกรรมที่มีกำหนดปล่อยในวันศุกร์นี้

Laurie Bailey 06:30 2025-07-09 UTC+2

การคาดการณ์ USD/JPY ประจำวันที่ 9 กรกฎาคม 2025

USD/JPY คู่เงิน USD/JPY ดูเหมือนว่าจะกำลังจะเสร็จสิ้นการก่อตัวของรูปแบบสามเหลี่ยม ซึ่งมีหลายสถานการณ์ที่เป็นไปได้ ตามสถานการณ์หลัก คู่นี้อาจทดสอบขอบเขตด้านบนของรูปสามเหลี่ยมที่ระดับ 147.75 และจากนั้นจะเกิดการทะลุลงด้านล่าง ในสถานการณ์ที่สอง การปรับฐานอาจเกิดขึ้นจากระดับ 147.75 ไปสู่ 146.11 จากนั้นมีการทะลุทะลวงขึ้นจากสามเหลี่ยมโดยมีเป้าหมายที่

Laurie Bailey 06:25 2025-07-09 UTC+2

สัญญาณการซื้อขายสำหรับ EUR/USD วันที่ 8-12 กรกฎาคม 2025: ซื้อเมื่อราคาสูงกว่า 1.1650 (21 SMA - 8/8 Murray)

ตัวบ่งชี้อีเกิล (Eagle Indicator) ได้ถึงระดับที่ขายมากเกินไปแล้ว ดังนั้นเราจึงเชื่อว่ายูโรอาจฟื้นตัวขึ้นเหนือ 1.1680 ในชั่วโมงถัดไป และจากนั้นอาจไปถึง 1.1718 ซึ่งเป็นตำแหน่งของ 8/8 Murray และอาจไปถึงที่ 1.1770 ซึ่งเป็นระดับแนวต้านที่แข็งแกร่ง

Dimitrios Zappas 18:58 2025-07-08 UTC+2

สัญญาณการซื้อขายสำหรับ GOLD (XAU/USD) ระหว่างวันที่ 8-12 กรกฎาคม 2025: แนะนำให้ซื้อเมื่อราคาสูงกว่า $3,285 (21 SMA - 4/8 Murray)

ในช่วงเริ่มต้นของตลาดอเมริกา ราคาทองกำลังซื้อขายอยู่ที่ประมาณ 3,295 กลับมาขึ้นหลังจากที่ร่วงลงไปถึง 3,285 ทองอ่อนค่าหลังจากที่ Trump ประกาศขยายอัตราภาษีออกไป ตามกราฟ H4 ทองกลับมาขึ้นหลังจากแตะจุดต่ำสุดของช่องแนวโน้มขาลงเหนือระดับ 4/8 ของ Murray เราเชื่อว่าในวันข้างหน้าอาจมีการฟื้นตัวเล็กน้อยของโลหะสีเหลืองนี้

Dimitrios Zappas 18:56 2025-07-08 UTC+2
หากไม่สะดวกคุยในตอนนี้
ระบุคำถามไว้ได้ใน แชท.
Widget callback
 

Dear visitor,

Your IP address shows that you are currently located in the USA. If you are a resident of the United States, you are prohibited from using the services of InstaFintech Group including online trading, online transfers, deposit/withdrawal of funds, etc.

If you think you are seeing this message by mistake and your location is not the US, kindly proceed to the website. Otherwise, you must leave the website in order to comply with government restrictions.

Why does your IP address show your location as the USA?

  • - you are using a VPN provided by a hosting company based in the United States;
  • - your IP does not have proper WHOIS records;
  • - an error occurred in the WHOIS geolocation database.

Please confirm whether you are a US resident or not by clicking the relevant button below. If you choose the wrong option, being a US resident, you will not be able to open an account with InstaForex anyway.

We are sorry for any inconvenience caused by this message.