empty
17.01.2024 06:44 AM
Trading Signals for GOLD on January 17-18, 2024: sell below $2,035 (200 EMA - pivot point)

This image is no longer relevant

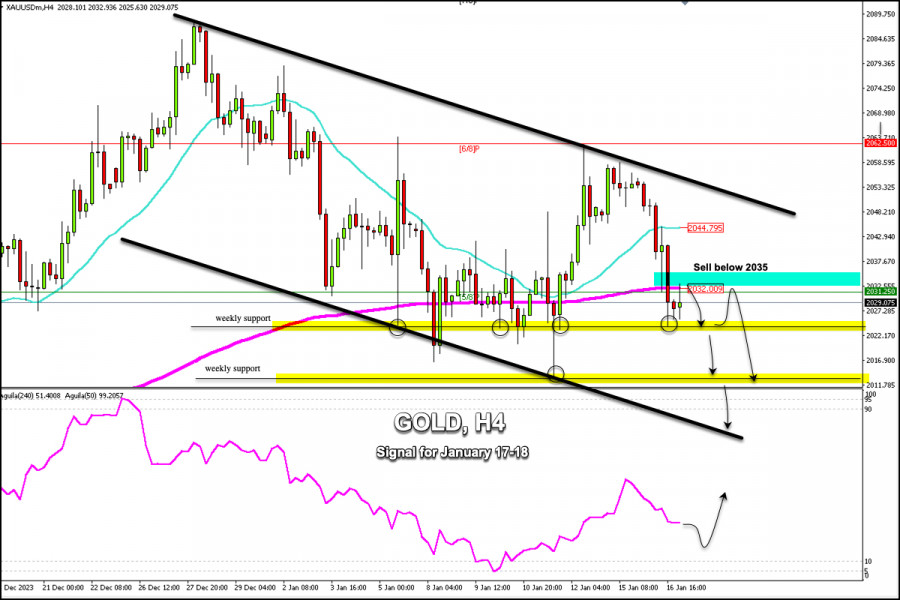
Early in the European session, gold is trading around 2,029.07, below the 200 EMA (2,032), and below the 21 SMA located at 2,044. In the H4 chart, we can see that gold is trading within a downtrend channel forming since December 22. In the next few hours, the price is likely to continue declining only if it consolidates below the daily pivot point located at 2,035.

Gold is under downward pressure. Since January 10, gold has tried to break the 6/8 Murray (2,062), the level that coincided with the top of the downtrend channel, and could not break it. Since then, we observed a strong downward acceleration. XAU could likely fall and consolidate around the low of January 10 at 2,013. If bearish strength prevails it could reach 4/8 Murray around the psychological level of $2,000.

Gold has strong support around 2,022. Yesterday during the American session, it reached this area and since then had a technical rebound. If gold falls towards this level in the next few hours and proves that this weekly support is strong, it could offer a technical rebound and reach the pivot point area in 2,035.

In case gold recovers and consolidates above the 200 EMA located at 2,032 and above 2,035, it could be seen as an opportunity to buy with targets at 2,044 and at the top of the downtrend channel around 2,050.

On the other hand, in case the technical rebound is not so strong and gold finds resistance around 2,035, it will be seen as an opportunity to sell with targets at 2,023, 2,013 and at the psychological level of $2,000.

Summary
Urgency
Analytic
Dimitrios Zappas
Start trade
รับผลกำไรจากการเปลี่ยนแปลงอัตราสกุลเงินดิจิทัลกับ InstaForex.
ดาวน์โหลด MetaTrader 4 และเปิดการซื้อขายครั้งแรกของคุณ.
  • Grand Choice
    Contest by
    InstaForex
    InstaForex always strives to help you
    fulfill your biggest dreams.
    เข้าร่วมการแข่งขัน


บทความแนะนำ

GBP/USD. การวิเคราะห์ทางเทคนิคสำหรับสัปดาห์ที่ 28 กรกฎาคม – 2 สิงหาคม

ในสัปดาห์นี้ ราคามีแนวโน้มที่จะปรับลงจากระดับ 1.3435 (ราคาปิดของแท่งเทียนรายสัปดาห์ล่าสุด) โดยมีเป้าหมายที่ระดับ 1.3269 ซึ่งเป็นแนวรับทางประวัติศาสตร์ (เส้นประสีน้ำเงิน) เมื่อทดสอบแนวรับนี้แล้ว ราคามีโอกาสที่จะปรับขึ้นเพื่อทำการแก้ไขไปยัง 1.3410 ซึ่งเป็น EMA ระยะ

Stefan Doll 19:16 2025-07-28 UTC+2

EUR/USD การวิเคราะห์ทางเทคนิคประจำสัปดาห์ของวันที่ 28 กรกฎาคม – 2 สิงหาคม

ในสัปดาห์นี้ ตลาดอาจเริ่มเคลื่อนไหวลงจากระดับ 1.1742 (จุดปิดของแท่งเทียนรายสัปดาห์ล่าสุด) โดยมีเป้าหมายที่ 1.1536 ซึ่งเป็นระดับการถอยกลับ 38.2% (เส้นประสีน้ำเงิน) เมื่อทำการทดสอบระดับนี้แล้ว ราคาอาจเริ่มเคลื่อนตัวขึ้นโดยมีเป้าหมายที่ 1.1571 ซึ่งเป็นฟรัคทัลด้านบน (เส้นประสีแดง) รูปที่

Stefan Doll 19:12 2025-07-28 UTC+2

การพยากรณ์ค่าเงิน Forex วันที่ 28/07/2025: EUR/USD, USD/JPY, GBP/USD, ทองคำ, Ethereum และ Bitcoin

ลิงก์ที่มีประโยชน์: บทความอื่นๆ ของฉันสามารถอ่านได้ในส่วนนี้ คอร์ส InstaForex สำหรับผู้เริ่มต้น วิเคราะห์ข้อมูลยอดนิยม เปิดบัญชีสำหรับการเทรด สำคัญ: ผู้เริ่มต้นในการซื้อขายฟอเร็กซ์ควรระมัดระวังอย่างยิ่งเมื่อทำการตัดสินใจเกี่ยวกับการเข้าสู่ตลาด ก่อนที่รายงานสำคัญจะถูกประกาศ ควรอยู่นอกตลาดเพื่อป้องกันการถูกกระทบจากความผันผวนของตลาดที่รุนแรงขึ้น หากตัดสินใจซื้อขายในช่วงที่มีการประกาศข่าว ควรตั้ง Stop

Sebastian Seliga 11:32 2025-07-28 UTC+2

EUR/USD: การวิเคราะห์และคาดการณ์

ในการเริ่มต้นสัปดาห์ใหม่ในช่วงตลาดเอเชีย คู่เงิน EUR/USD พยายามรักษาความเป็นบวกไว้ แต่ในช่วงตลาดยุโรป ราคากลับลดลงต่ำกว่าระดับ 1.1750 ท่ามกลางความคาดหวังของข้อมูลมหภาคที่สำคัญของสหรัฐฯ ที่จะออกในสัปดาห์นี้ และการประชุม FOMC สองวันที่สำคัญซึ่งจะเริ่มในวันอังคาร ในด้านเทคนิค บนกราฟ

Irina Yanina 11:13 2025-07-28 UTC+2

EUR/USD – 28 กรกฎาคม: สหภาพยุโรปและสหรัฐอเมริกาบรรลุข้อตกลง

เมื่อวันศุกร์ คู่เงิน EUR/USD กลับมาที่ระดับการกลับตัว 127.2% ที่ 1.1712 และมีการดีดกลับจากจุดนั้น ซึ่งบ่งบอกว่าการเคลื่อนไหวขึ้นอาจจะต่อเนื่องไปยังระดับถัดไปที่ 1.1802 หากมีการเคลื่อนไหวที่ต่ำกว่า 1.1712 อย่างแข็งแกร่ง จะเป็นการสนับสนุนค่าเงินดอลลาร์สหรัฐและบ่งบอกถึงการลดลงไปยัง 1.1645

Samir Klishi 10:58 2025-07-28 UTC+2

GBP/USD – วันที่ 28 กรกฎาคม: สหรัฐอเมริกาและจีนบรรลุข้อตกลงเช่นกัน

ในแผนภูมิรายชั่วโมง คู่เงิน GBP/USD ยังคงมีการลดลงต่อเนื่องในวันศุกร์ไปสู่ระดับ 1.3425 หลังจากปิดตัวต่ำกว่าระดับการฟื้นตัว 76.4% ที่ 1.3470 วันนี้ หากมีการเคลื่อนไหวที่ชัดเจนต่ำกว่า 1.3425 จะส่งสัญญาณถึงความเป็นไปได้ในการลดลงเพิ่มเติมไปยังโซนสนับสนุนที่ 1.3357-1.3371 การดีดตัวกลับจากระดับ

Samir Klishi 10:40 2025-07-28 UTC+2

จาก Golden Cross ในวันนี้ที่เกิดขึ้นบนคู่เงิน USD/CAD ทำให้ค่าเงิน Loonie มีศักยภาพที่จะเข้มแข็งขึ้นและอาจขึ้นไปถึงระดับแนวต้านที่ใกล้ที่สุดในวันจันทร์ที่ 28 กรกฎาคม 2025

USD/CAD – วันจันทร์ที่ 28 กรกฎาคม 2025 แม้ว่า RSI (14) จะอยู่ในระดับเป็นกลางถึงขาลง แต่สัญญาณ Golden Cross ระหว่าง 50-EMA

Arief Makmur 08:07 2025-07-28 UTC+2

Fiber อาจมีโอกาสอ่อนค่าลงในวันนี้ โดยมีแนวโน้มว่าแนว Pivot อาจถูกทำลาย วันจันทร์ที่ 28 กรกฎาคม 2025

EUR/USD – วันจันทร์ที่ 28 กรกฎาคม 2025 ความแตกต่างระหว่างการเคลื่อนไหวของราคา Fiber และตัวชี้วัด RSI(14) ปรากฏขึ้น แม้ว่า

Arief Makmur 08:07 2025-07-28 UTC+2

สัญญาณการซื้อขายสำหรับ EUR/USD วันที่ 28-30 กรกฎาคม 2025: ขายต่ำกว่า 1.1780 (21 SMA - 8/8 Murray)

ในช่วงต้นของการซื้อขายสหรัฐฯ ยูโรซื้อขายอยู่ราว 1.1752 กลับมาฟื้นตัวหลังจากพบการสนับสนุนที่ดีราว 1.1718 เมื่อสัปดาห์ที่แล้ว ยูโรได้ทะลุกรอบขาขึ้นอย่างรวดเร็วและตอนนี้แสดงสัญญาณของความอ่อนแรง เราเชื่อว่ายูโรอาจร่วงไปยัง 200 EMA ที่ 1.1636 ในช่วงไม่กี่วันนี้ การย่อตัวใต้ 21SMA

Dimitrios Zappas 06:43 2025-07-28 UTC+2

สัญญาณการซื้อขายสำหรับ BITCOIN ประจำวันที่ 28-30 กรกฎาคม 2025: ขายเมื่อราคาต่ำกว่า $119,800 (200 EMA - 21 SMA)

บิตคอยน์กำลังอยู่ในช่วงปรับฐานหลังจากเพิ่งถึงระดับ $19,750 เมื่อไม่นานมานี้ BTC กำลังอยู่ในช่วงปรับฐานเชิงเทคนิค ดังนั้นราคามีแนวโน้มที่จะลดลงในชั่วโมงต่อๆ มามุ่งสู่ 21SMA ที่อยู่ที่ 117,744 บนกราฟ H4 บิตคอยน์อยู่ในช่วงการรวมฐาน ราคาต้านทานที่รุนแรงจะเห็นได้ที่ประมาณ $121,000

Dimitrios Zappas 06:41 2025-07-28 UTC+2
หากไม่สะดวกคุยในตอนนี้
ระบุคำถามไว้ได้ใน แชท.
Widget callback
 

Dear visitor,

Your IP address shows that you are currently located in the USA. If you are a resident of the United States, you are prohibited from using the services of InstaFintech Group including online trading, online transfers, deposit/withdrawal of funds, etc.

If you think you are seeing this message by mistake and your location is not the US, kindly proceed to the website. Otherwise, you must leave the website in order to comply with government restrictions.

Why does your IP address show your location as the USA?

  • - you are using a VPN provided by a hosting company based in the United States;
  • - your IP does not have proper WHOIS records;
  • - an error occurred in the WHOIS geolocation database.

Please confirm whether you are a US resident or not by clicking the relevant button below. If you choose the wrong option, being a US resident, you will not be able to open an account with InstaForex anyway.

We are sorry for any inconvenience caused by this message.