empty
02.02.2024 06:41 AM
Trading Signals for GOLD (XAU/USD) on February 2-6, 2024: sell below $2,062 (6/8 Murray - 200 EMA)

This image is no longer relevant

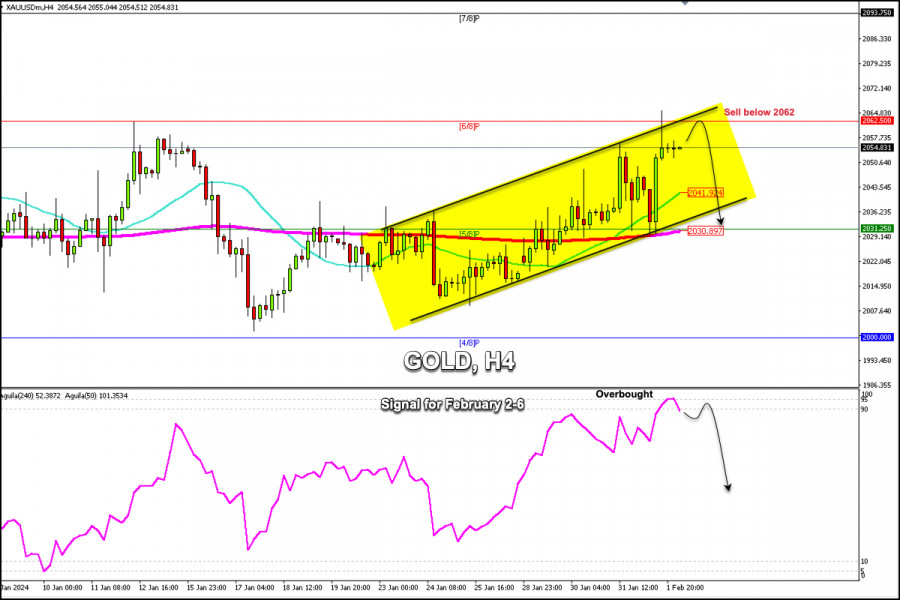
Gold is trading around 2,053.35, below 2/8 Murray, and above the moving averages of 200 and 21. Yesterday during the American session, gold bounced strongly above the 200 EMA and above 5/8 Murray after the US data.

On the H4 chart, we can see that gold is trading within the uptrend channel forming since January 24. In the next few hours, the metal is likely to continue its rise but could face strong resistance located around 2,062.

Technically, gold is strongly overbought. So, if it fails to consolidate above 2,063 in the coming days, it could be seen as a signal to sell with the target at 2,041 area (21 SMA). Additionally, if there is a sharp break in the uptrend channel, the instrument could cover the GAP that it left on January 26 around 2,018.

Yesterday during the European session, gold fell sharply but the 200 EMA gave it strong support. After the price had hit the bottom of the bullish trend channel, it gained strong momentum, achieving an accumulation of more than $30 in profit until reaching the weekly high of 2,065. This is a sign that gold could continue to rise in the coming days.

We believe that gold could make a technical correction in the next few hours and could find first support around 2,041. In case this level is broken, gold should find strong support at 2,030. In case gold breaks below this area, the price could have a bearish acceleration. Thus, the instrument could reach the psychological level of $2,000 in the coming days.

Meanwhile, we believe that any technical bounce and as long as gold trades above 2,035 will be seen as a signal to buy. Gold will come under bearish pressure below 2,062 and below 2,030.

Summary
Urgency
Analytic
Dimitrios Zappas
Start trade
รับผลกำไรจากการเปลี่ยนแปลงอัตราสกุลเงินดิจิทัลกับ InstaForex.
ดาวน์โหลด MetaTrader 4 และเปิดการซื้อขายครั้งแรกของคุณ.
วิธีการเทรดคู่เงิน GBP/USD ในวันที่ 4 กันยายน? เคล็ดลับง่าย ๆ และการวิเคราะห์การเทรดสำหรับผู้เริ่มต้น ในวันพุธ คู่สกุลเงิน GBP/USD มีการซื้อขายที่สูงขึ้น จำได้ว่าในวันอังคาร ค่าเงินปอนด์ร่วงลงอย่างรุนแรง โดยหลายๆ ผู้เชี่ยวชาญได้อธิบายว่าเป็นเพราะการเพิ่มขึ้นของอัตราผลตอบแทนพันธบัตรรัฐบาลของสหราชอาณาจักร เราถือว่านี่เป็นเหตุผลที่เหมาะสม แต่ในขณะเดียวกัน ขอเตือนว่าผลตอบแทนจากพันธบัตรสหรัฐก็เพิ่มขึ้นเช่นกัน และการเพิ่มขึ้นของอัตราผลตอบแทนนั้นหมายถึงการเพิ่มแรงกดดันในงบประมาณใดๆ ดังนั้น การเพิ่มขึ้นของผลตอบแทนในสหราชอาณาจักรถือว่าน่าวิตกสำหรับทั้งเศรษฐกิจอังกฤษและเงินปอนด์ แต่สถานการณ์ในสหรัฐก็ไม่ได้ดีขึ้นเช่นกัน
  • Grand Choice
    Contest by
    InstaForex
    InstaForex always strives to help you
    fulfill your biggest dreams.
    เข้าร่วมการแข่งขัน


บทความแนะนำ

การคาดการณ์ EUR/USD สำหรับวันที่ 4 กันยายน 2025

EUR/USD ณ วันพุธที่ผ่านมา ค่าเงินยูโรเพิ่มขึ้น 20 จุด ทำให้การยืนยันต่ำกว่าระดับ 1.1632 ต้องเลื่อนออกไปเล็กน้อย อาจเป็นไปได้ว่าในวันนี้กราฟเทียนจะปิดต่ำกว่าระดับสนับสนุน เนื่องจากดัชนี ISM Services PMI สำหรับเดือนสิงหาคมคาดว่าจะเพิ่มขึ้นจาก

Laurie Bailey 05:07 2025-09-04 UTC+2

การพยากรณ์สำหรับ GBP/USD ในวันที่ 4 กันยายน 2025

GBP/USD การทดสอบระดับแนวรับที่ 1.3364 สองครั้งโดยรวมของเงาแท่งเทียนในกราฟรายวันในวันอังคารและวันพุธ ยังคงรักษาความมุ่งมั่นของฝั่งเจ้ามาหมีไว้อย่างเหนียวแน่น หากวันนี้ราคายังไม่กลับมาสู่จุดรองรับเนื่องจากยังอยู่เหนือเส้นสมดุล มันอาจกลับมาพรุ่งนี้พร้อมกับการเปิดเผยข้อมูลการจ้างงานสหรัฐฯ โดยเป้าหมายจะอยู่ที่ 1.3253 ตัวโอซิลเลเตอร์ Marlin ก็อยู่ในตำแหน่งที่เป็นกลางตามเส้นศูนย์ ณ วันนี้เช่นกัน บนกราฟสี่ชั่วโมง

Laurie Bailey 05:07 2025-09-04 UTC+2

การคาดการณ์ AUD/USD สำหรับวันที่ 4 กันยายน 2025

AUD/USD เป็นวันที่สามติดต่อกันแล้วที่ค่าเงินดอลลาร์ออสเตรเลียได้ทดสอบเส้น MACD ด้วยเงาบนของแท่งเทียนรายวัน เส้นสัญญาณของออสซิลเลเตอร์ Marlin มีแนวโน้มที่จะลดลงมากขึ้น โดยเคลื่อนห่างออกจากระดับแนวต้านที่ 0.0059 สำหรับการเคลื่อนไหวลงอย่างมั่นใจ ราคาจะต้องลดลงต่ำกว่าระดับสมดุล; ในตอนนี้อาจกำลังเตรียมฐานให้กับ Marlin oscillator เพื่อลงไปอยู่ในเขตลบด้วยเช่นกัน

Laurie Bailey 05:07 2025-09-04 UTC+2

การคาดการณ์สำหรับ EUR/USD ในวันที่ 3 กันยายน 2025

เมื่อวันอังคารที่ผ่านมา EUR/USD ได้ปรับลดลงอย่างชัดเจนโดยดีดตัวในฝั่งของเงินดอลลาร์สหรัฐและปิดต่ำกว่าพื้นที่แนวรับที่ 1.1637–1.1645 การเคลื่อนไหวลงอาจดำเนินต่อไปในวันนี้ไปยังระดับ Fibonacci retracement 50.0% ถัดไปที่ 1.1590 ซึ่งในอดีตคู่สกุลเงินนี้ได้ทะยานขึ้นจากระดับนี้แล้วสองครั้ง หากคู่อยู่เหนือ 1.1637–1.1645 จะเป็นประโยชน์ต่อยูโรซึ่งอาจเติบโตขึ้นไปยังระดับ Fibonacci

Samir Klishi 11:11 2025-09-03 UTC+2

การคาดการณ์สำหรับคู่เงิน GBP/USD ในวันที่ 3 กันยายน 2025

ในกราฟรายชั่วโมงของ GBP/USD เมื่อวันอังคาร คู่เงินนี้ได้กลับทิศทางในทางที่แข็งแรงสำหรับดอลลาร์สหรัฐและปรับตัวลดลงไปยังโซนแนวรับที่ 1.3357–1.3364 การดีดตัวกลับจากโซนนี้วันนี้จะเป็นผลดีกับเงินปอนด์และอาจมีการปรับตัวขึ้นไปยังโซนแนวต้านที่ 1.3416–1.3425 การปิดคู่เงินต่ำกว่า 1.3357–1.3364 จะเปิดทางให้การลดลงต่อไปยังระดับ Fibonacci 38.2% ที่ 1.3311 ได้

Samir Klishi 10:57 2025-09-03 UTC+2

GBP/USD: การวิเคราะห์ตัวบ่งชี้ ณ วันที่ 3 กันยายน 2025

การวิเคราะห์แนวโน้ม (รูปที่ 1). ในวันพุธ ตลาดอาจเคลื่อนไหวลงจากระดับ 1.3391 (ระดับปิดรายวันของเมื่อวาน) ไปยัง 1.3313 ซึ่งเป็นระดับการถอยกลับ 61.8% (เส้นประสีเหลือง) เมื่อทดสอบระดับนี้แล้ว ราคาอาจดีดกลับขึ้นไปที่ 1.3366

Stefan Doll 10:48 2025-09-03 UTC+2

EUR/USD: การวิเคราะห์ตัวชี้วัด วันที่ 3 กันยายน 2025

การวิเคราะห์แนวโน้ม (รูปที่ 1) ในวันพุธ ตลาดจากระดับ 1.1648 (ปิดตลาดรายวันของเมื่อวาน) อาจมีการเคลื่อนไหวลงต่อ เป้าหมายไปที่ 1.1594 ซึ่งเป็นระดับถอยกลับ 50% (เส้นประสีเหลือง) เมื่อทดสอบระดับนี้แล้ว ราคามีโอกาสดีดตัวขึ้น

Stefan Doll 10:42 2025-09-03 UTC+2

หากระดับ Pivot สามารถรักษาการปรับฐานใน XPD/USD ได้ มีโอกาสที่มันจะมีความแข็งแกร่งและเพิ่มขึ้นไปยังระดับแนวต้านที่ใกล้ที่สุด วันพุธที่ 3 กันยายน 2025

[XPD/USD] – [วันพุธที่ 3 กันยายน 2025] XPD/USD มีรูปแบบ Death Cross ในการตัดผ่านเส้น EMA ถึงแม้ว่า RSI จะอยู่ในระดับเป็นกลางที่เอนเอียงไปในทิศทางขาลง

Arief Makmur 09:54 2025-09-03 UTC+2

ก๊าซธรรมชาติมีแนวโน้มที่จะอ่อนตัวลงในวันนี้ ลดลงไปถึงระดับแนวรับที่ใกล้ที่สุด วันพุธที่ 3 กันยายน 2025

[ก๊าซธรรมชาติ] – [วันพุธที่ 3 กันยายน 2025] ด้วยตำแหน่ง EMA (50) ที่อยู่เหนือ EMA (200) และตัวชี้วัด RSI อยู่ในพื้นที่

Arief Makmur 09:54 2025-09-03 UTC+2

คาดการณ์สำหรับวันที่ 3 กันยายน 2025

EUR/USD หลังจากที่เมื่อวานอัตราผลตอบแทนพันธบัตรรัฐบาลยุโรปพุ่งสูงขึ้น, ดัชนีหุ้น EuroStoxx50 ลดลง 1.41% (DAX -2.29%), และค่าเงินยูโรตกลง 0.67% พร้อมกับสถานการณ์วิกฤตการเมืองในฝรั่งเศสที่ทวีความรุมร้อนขึ้น มันเริ่มชัดเจนว่า วิกฤตการเงินใหม่กำลังเริ่มต้นขึ้นที่นี่—ในยุโรป เราเขียนเกี่ยวกับเรื่องนี้เมื่อวันที่

Laurie Bailey 05:51 2025-09-03 UTC+2
หากไม่สะดวกคุยในตอนนี้
ระบุคำถามไว้ได้ใน แชท.
Widget callback
 

Dear visitor,

Your IP address shows that you are currently located in the USA. If you are a resident of the United States, you are prohibited from using the services of InstaFintech Group including online trading, online transfers, deposit/withdrawal of funds, etc.

If you think you are seeing this message by mistake and your location is not the US, kindly proceed to the website. Otherwise, you must leave the website in order to comply with government restrictions.

Why does your IP address show your location as the USA?

  • - you are using a VPN provided by a hosting company based in the United States;
  • - your IP does not have proper WHOIS records;
  • - an error occurred in the WHOIS geolocation database.

Please confirm whether you are a US resident or not by clicking the relevant button below. If you choose the wrong option, being a US resident, you will not be able to open an account with InstaForex anyway.

We are sorry for any inconvenience caused by this message.