empty
20.03.2023 02:04 PM
Technical analysis of GBP/USD for March 20, 2023

This image is no longer relevant

Overview :

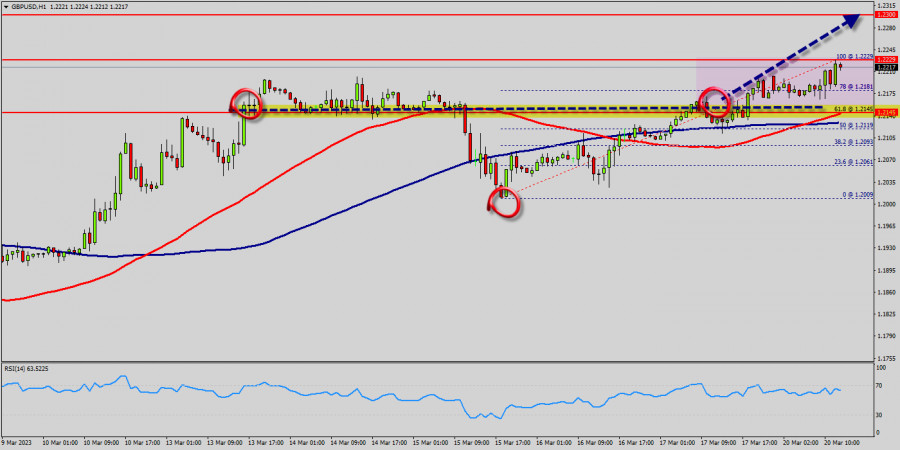
The GBP/USD pair traded higher and closed the day in the positive territory near the price of 1.2208. Right now, it was trading in a narrow range of 1.2150 staying close to a 2-days high. On the hourly chart, the GBP/USD pair is still trading above the MA (100) H1 moving average line (1.2068 - weekly pivot point). The situation is similar on the 4-hour chart. Based on the foregoing, it is probably worth sticking to the north direction in trading, and as long as the GBP/USD pair remains above MA 100 H1, it may be necessary to look for entry points to buy for the formation of a correction.

All elements being clearly bullish, it would be possible for traders to trade only long positions on the GBP/USD pair as long as the price remains well above the golden ratio of 1.2068. The buyers' bullish objective is set at 1.2209.

The price is likely to form a double top in the same time frame. Accordingly, the GBP/USD pair is showing signs of strength following a breakout of the highest level of 1.2209. So, buy above the level of 1.2068 with the first target at 1.2209 in order to test the daily resistance 1. The level of 1.2209 is a good place to take profits.

Moreover, the RSI is still signaling that the trend is upward as it remains strong above the moving average (100). This suggests that the pair will probably go up in coming hours. A bullish break in this resistance would boost the bullish momentum. Other outlook for the GBP/USD pair : Pound Sterling is currently trading at 1.2150. If the trend reverses from this point, then a possible future share price target could be 1.2209.

If the price of Pound Sterling is trading above 1.2150 then possibility of upside targets getting achieved is higher around the level of 1.2150. The basic bullish trend is very strong on the GBP/USD pair, but the short term shows some signs of running out of steam. Nevertheless, a purchase could be considered as long as the price remains above 1.2150.

Crossing the first resistance at 1.2209 would be a sign of a potential new surge in the price. Buyers would then use the next resistance located at 1.2270 as an objective. Crossing it would then enable buyers to target 1.2270. Caution, a return to below 1.2270 would be a sign of a consolidation phase in the short-term basic trend. If this is the case, remember that trading against the trend may be riskier.

It would seem more appropriate to wait for a signal indicating reversal of the trend. In the very short term, the general bullish sentiment is not called into question, despite technical indicators being indecisive. All elements being clearly bullish market, it would be possible for traders to trade only long positions on the GBP/USD pair as long as the price remains well above the price of 1.2068. The GBP/USD pair will continue rising from the level of 1.2068 in the long term.

It should be noted that the support is established at the level of 1.2068 which represents the last bearish wave. The price is likely to form a double bottom in the same time frame. Accordingly, the GBP/USD pair is showing signs of strength following a breakout of the highest level of 1.2068. So, buy above the level of 1.2068 with the first target at 1.2209 in order to test the daily resistance 1. The buyers' bullish objective is set at the level of 1.2270 (last bullish wave). A bullish break in this resistance would boost the bullish momentum.

The buyers could then target the resistance located at 1.2270 . This suggests that the pair will probably go up in coming hours. If the trend is able to break the level of 1.2209 (double top), then the market will call for a strong bullish market towards the objective of 1.2270 this week. If there is any crossing, the next objective would be the resistance located at 1.2270.

The level of 1.2270 is a good place to take profits. Moreover, the RSI is still signaling that the trend is upward as it remains strong above the moving average (100). Since the trend is above the 61.8% Fibonacci level (1.2068), it means the market is still in a uptrend. From this point, the GBP/USD pair is continuing in a bullish trend from the new support of 1.2068. This is shown to us as the current price is in a bullish channel.

According to the previous events, we expect that the GBP/USD pair will move between 1.2068 and 1.2270 in coming hours. It is also should be noted, beware of bullish excesses that could lead to a possible short-term correction; but this possible correction would not be tradeable.

On the other hand, in case a reversal takes place and the GBP/USD pair breaks through the support level of 1.2068, a further decline to 1.1981 can occur. It would indicate a bearish market.

Summary
Urgency
Analytic
Mourad El Keddani
Start trade
Kiếm lợi nhuận từ những biến đổi giá của tiền điện tử với InstaForex.
Tải MetaTrader 4 và mở giao dịch đầu tiên của bạn.
  • Grand Choice
    Contest by
    InstaForex
    InstaForex always strives to help you
    fulfill your biggest dreams.
    THAM GIA CUỘC THI

Các bài báo được đề xuất

Dự báo Forex ngày 15/07/2025: EUR/USD, GBP/USD, USD/JPY, Dầu và Bitcoin

Liên kết hữu ích: Các bài viết khác của tôi có sẵn trong phần này Khóa học InstaForex cho người mới bắt đầu Phân Tích Phổ Biến Mở tài khoản

Sebastian Seliga 12:58 2025-07-15 UTC+2

GBP/USD. Phân tích và Dự báo

Hôm nay, cặp GBP/USD đang củng cố trong phạm vi 1.3430–1.3435, duy trì hơi trên mức thấp nhất trong ba tuần được ghi nhận trong phiên giao dịch châu

Irina Yanina 12:18 2025-07-15 UTC+2

Dự báo cho EUR/USD vào ngày 15 tháng 7 năm 2025

Vào thứ Hai, cặp EUR/USD giao dịch trong tình trạng đi ngang, và hoạt động thị trường nhìn chung rất thấp. Vì vậy, mặc dù tâm lý thị trường giảm

Samir Klishi 11:46 2025-07-15 UTC+2

Dự báo cho GBP/USD vào ngày 15 tháng 7 năm 2025

Trên biểu đồ hàng giờ, cặp GBP/USD tiếp tục giảm vào thứ Hai và đến cuối ngày đã đạt đến vùng hỗ trợ 1.3425–1.3444. Một đợt bật lên từ vùng

Samir Klishi 11:30 2025-07-15 UTC+2

Mặc dù có khả năng xảy ra đợt điều chỉnh xuống mức hỗ trợ gần nhất, USD/CHF vẫn có khả năng quay trở lại xu hướng tăng giá vào thứ Ba, ngày 15 tháng 7 năm 2025.

USD/CHF - Thứ Ba, ngày 15 tháng 7, 2025. Với điều kiện Đường Cắt Vàng giữa EMA(50) và EMA(200) cho thấy rằng người mua vẫn đang chiếm

Arief Makmur 07:31 2025-07-15 UTC+2

Nếu khả năng tăng cường của Fiber được giữ ở mức Kháng cự 1, EUR/USD có khả năng suy yếu trở lại vào thứ Ba, ngày 15 tháng 7 năm 2025.

EUR/USD - Thứ Ba, ngày 15 tháng 7 năm 2025. Mặc dù RSI(14) ở mức 55.39 (Trung lập-Tăng nhẹ), EMA(50) nằm dưới EMA(200), cho thấy

Arief Makmur 07:31 2025-07-15 UTC+2

Dự báo EUR/USD cho ngày 15 tháng 7 năm 2025

Trên biểu đồ ngày, giá đã ổn định dưới mức 1.1692. Bộ dao động Marlin hiện đang đi vào lãnh thổ của xu hướng giảm. Mục tiêu tại mức 1.1535

Laurie Bailey 05:12 2025-07-15 UTC+2

Dự báo GBP/USD cho ngày 15 tháng 7, 2025

Tính đến cuối ngày thứ Hai, đồng bảng Anh củng cố dưới đường chỉ báo cân bằng, đang tiến gần mức hỗ trợ mục tiêu tại 1.3369 cách 65 điểm

Laurie Bailey 05:12 2025-07-15 UTC+2

Dự báo USD/JPY cho ngày 15 tháng 7 năm 2025

Sau khi phục hồi từ mức hỗ trợ tại 146.11, cặp USD/JPY đã đạt đến đường trên của mô hình cái nêm trên biểu đồ hàng ngày và hiện đang

Laurie Bailey 05:12 2025-07-15 UTC+2

USD/JPY. Phân Tích và Dự Báo

Cặp tiền tệ USD/JPY tiếp tục đi ngang gần mức cao nhất trong ba tuần do sức mạnh của đồng đô la Mỹ và các tín hiệu thị trường

Irina Yanina 12:17 2025-07-14 UTC+2
Không thể nói chuyện ngay bây giờ?
Đặt câu hỏi của bạn trong phần trò chuyện.
Widget callback
 

Dear visitor,

Your IP address shows that you are currently located in the USA. If you are a resident of the United States, you are prohibited from using the services of InstaFintech Group including online trading, online transfers, deposit/withdrawal of funds, etc.

If you think you are seeing this message by mistake and your location is not the US, kindly proceed to the website. Otherwise, you must leave the website in order to comply with government restrictions.

Why does your IP address show your location as the USA?

  • - you are using a VPN provided by a hosting company based in the United States;
  • - your IP does not have proper WHOIS records;
  • - an error occurred in the WHOIS geolocation database.

Please confirm whether you are a US resident or not by clicking the relevant button below. If you choose the wrong option, being a US resident, you will not be able to open an account with InstaForex anyway.

We are sorry for any inconvenience caused by this message.