empty
01.03.2024 09:50 AM
Technical Analysis of GBP/USD for March 1, 2024

GBP/USD Analysis: Navigating a Narrow Range Amidst Market Anticipation

Key Takeaways:

  1. The GBP/USD pair has breached a short-term supply zone, hinting at bullish momentum with a potential move toward the 1.2691 level.
  2. A mix of buy and sell signals from technical indicators and moving averages suggests a market in consolidation, awaiting a decisive breakout.
  3. Sentiment has shifted slightly towards bears in the last three days, despite a generally bullish stance over the past week.

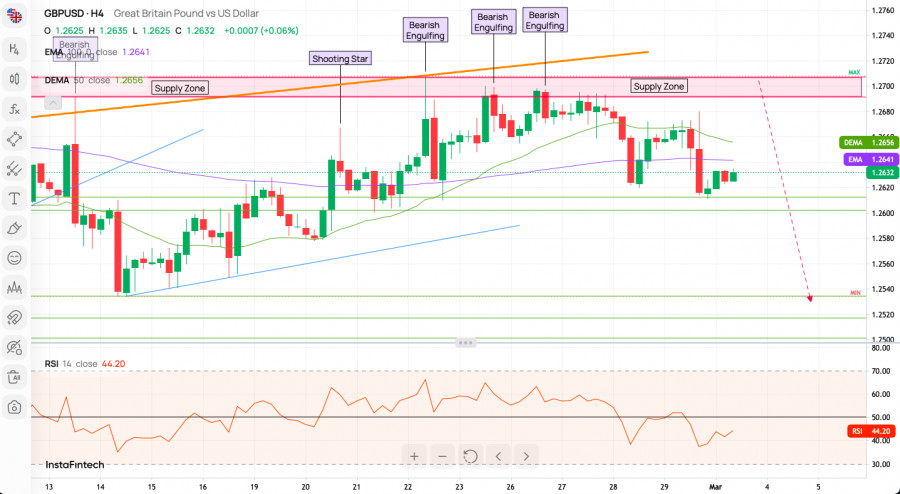
The GBP/USD pair has recently demonstrated a bullish inclination, successfully breaching the short-term supply zone. A sustained move above the 100-day moving average (MA) suggests potential for further upward momentum. However, the pair is currently consolidating gains, indicating a pivotal moment for traders as the market seeks direction.

This image is no longer relevant

Technical Highlights:
  • Uptrend Attempts: The pair's climb above the short-term supply zone (1.2613 - 1.2595) and subsequent local peak at 1.2628 indicates a positive outlook. The ascending momentum is intact, which could entice the bulls to propel the pair beyond the 100 MA (1.2625), targeting 1.2691.
  • Intraday Supports: Immediate technical support levels are established at 1.2612, 1.2603, and 1.2595. A dip below these floors may shift short-term sentiment to bearish, necessitating vigilance among bulls.
  • MA Confinement: The GBP/USD oscillation between the 50 MA (1.2620) and 100 MA (1.2579) underscores a horizontal trend, with market participants on the lookout for a decisive break. The crucial short-term support marks at 1.2517, a swing low from February 5th, 2024, remain vital to the pair's resilience.
Indicator Insights:
  • Mixed Indicator Signals: The technical indicators present a varied landscape, with 10 flashing 'Buy', 6 signaling 'Sell', and 6 remaining neutral. This divergence suggests a market in contemplation, weighing its next move.
  • Moving Average Trends: An overwhelming majority of moving averages (17 out of 18) suggest a 'Sell' signal, with only one contrarian 'Buy' signal. This could indicate underlying bearish pressure despite the recent bullish activity.

This image is no longer relevant

Sentiment Analysis:
  • Bullish Undertone: The sentiment scoreboard reflects a predominantly bullish stance, with a 55% majority over the bears' 45%. This bullish trend is consistent with last week's sentiment. However, a recent shift shows a three-day bearish turn (44% bulls vs. 56% bears), hinting at a potential change in trader sentiment.
Pivot Point Projections:
  • Resistance Levels: WR3 (1.27136), WR2 (1.26917), WR1 (1.26836)
  • Pivot Line: Weekly Pivot at 1.26698
  • Support Levels: WS1 (1.26617), WS2 (1.26479), WS3 (1.26260)

The GBP/USD pair currently hovers near a critical juncture, with bulls eager to cement their control. The recent bullish sentiment on the scoreboard and the technical breach above the supply zone provide a constructive backdrop. Nevertheless, the predominance of 'Sell' signals from moving averages and a shift to bearish sentiment in the last three days introduce caution. As the currency pair wrestles with moving average thresholds, the directional bias remains somewhat uncertain.

Useful Links

Important Notice

The begginers in forex trading need to be very careful when making decisions about entering the market. Before the release of important reports, it is best to stay out of the market to avoid being caught in sharp market fluctuations due to increased volatility. If you decide to trade during the news release, then always place stop orders to minimize losses.

Without placing stop orders, you can very quickly lose your entire deposit, especially if you do not use money management and trade large volumes. For successful trading, you need to have a clear trading plan and stay focues and disciplined. Spontaneous trading decision based on the current market situation is an inherently losing strategy for a scalper or daytrader.

#instaforex #analysis #sebastianseliga

Summary
Urgency
Analytic
Sebastian Seliga
Start trade
ইনস্টাফরেক্স দিয়ে ক্রিপ্টোমুদ্রা দর পরিবর্তনে আয় করুন।
মেটাট্রেডার 4 ডাউনলোড করে আপনার প্রথম ট্রেড চালু করুন।
  • Grand Choice
    Contest by
    InstaForex
    InstaForex always strives to help you
    fulfill your biggest dreams.
    প্রতিযোগীতায় অংশগ্রহণ করুন

সুপারিশকৃত নিবন্ধ

স্বর্ণের (XAU/USD) ট্রেডিং সিগন্যাল (২৫–২৮ জুলাই, ২০২৫): স্বর্ণের মূল্য $3,359-এর ওপরে থাকলে ক্রয় করুন এবং $3,392-এর (21 SMA – 6/8 মারে) নিচে থাকলে বিক্রি করুন

স্বর্ণ বর্তমানে $3,359-এর আশেপাশে ট্রেড করছে, যা 6/8 মারে-এর গুরুত্বপূর্ণ সাপোর্টের ঠিক ওপরে অবস্থিত এবং স্বর্ণের মূল্য 21 SMA-এর নিচে অবস্থান করছে। সম্প্রতি স্বর্ণের মূল্য 8/8 মারে-এর শক্তিশালী রেজিস্ট্যান্স লেভেল

Dimitrios Zappas 09:22 2025-07-25 UTC+2

বিটকয়েনের ট্রেডিং সিগন্যাল (২৫–২৮ জুলাই, ২০২৫): মূল্য $115,000-এর (5/8 মারে – 21 SMA) উপর থাকা অবস্থায় বিটকয়েন কিনুন

যদি বিটকয়েনের দরপতন অব্যাহত থাকে, তাহলে $115,000 (5/8 মারে) লেভেলের নিচে কনসোলিডেশন হতে পারে, যার ফলে BTC-এর মূল্য প্রথমে $113,519 (200 EMA) এবং তারপর 4/8 মারে-এর কাছাকাছি $112,500 পর্যন্ত নেমে

Dimitrios Zappas 09:17 2025-07-25 UTC+2

স্বর্ণের (XAU/USD) ট্রেডিং সিগন্যাল (২৪–২৭ জুলাই, ২০২৫): স্বর্ণের মূল্য $3,400-এর (21 SMA - 7/8 মারে) নিচে থাকা অবস্থায় বিক্রি করুন

গতকালকের বিশ্লেষণে যেমনটি উল্লেখ করা হয়েছিল, স্বর্ণের মূল্য শক্তিশালী রেজিস্ট্যান্স ও ওভারবট লেভেলে পৌঁছানোর পর ঊর্ধ্বমুখী প্রবণতা থেমে যায়। $3,437-এর নিচে পর্যন্ত টেকনিক্যাল কারেকশনের পর, স্বর্ণের মূল্য দ্রুত কমে গিয়ে

Dimitrios Zappas 09:23 2025-07-24 UTC+2

বিটকয়েনের ট্রেডিং সিগন্যাল (২৪–২৭ জুলাই, ২০২৫): বিটকয়েনের মূল্য $117,000 (6/8 মারে - 21 SMA)-এর উপরে থাকা অবস্থায় এটি ক্রয় করুন

বিটকয়েন বর্তমানে 6/8 মারে লাইনের শক্তিশালী রেজিস্ট্যান্সের উপরে ট্রেড করছে, যা ইঙ্গিত দিচ্ছে যে সামনের দিনগুলোতে এটির মূল্যের বুলিশ মুভমেন্ট অব্যাহত থাকতে পারে এবং মূল্য 7/8 মারে লাইনের কাছাকাছি $121,875

Dimitrios Zappas 09:15 2025-07-24 UTC+2

USD/CAD. বিশ্লেষণ ও পূর্বাভাস

USD/CAD পেয়ার বর্তমানে একটি বিয়ারিশ কনসলিডেশনের মধ্যে রয়েছে, যেখানে মূল্য 1.3600-এর সাইকোলজিক্যাল লেভেলের নিচে সংকীর্ণ রেঞ্জে ওঠানামা করছে। টেকনিক্যাল দৃষ্টিকোণ থেকে , এই পেয়ারের মূল্য 1.3635-এর হরাইজন্টাল সাপোর্ট লেভেল ব্রেক

Irina Yanina 12:09 2025-07-23 UTC+2

বিটকয়েন ট্রেডিং সিগন্যাল, ২৩–২৬ জুলাই, ২০২৫: বিটকয়েনের মূল্য $118,000 (21 SMA - 6/8 মারে)-এর ওপরে থাকলে এটি ক্রয় করুন

বিটকয়েন বর্তমানে প্রায় $118,000-এর আশেপাশে ট্রেড করছে, এটির মূল্য $120,000-এর সাইকোলজিক্যাল লেভেলে পৌঁছানোর পর একটি টেকনিক্যাল কারেকশনের শুরু হয়েছে। এই এরিয়াটি একটি শক্তিশালী রেজিস্ট্যান্স হিসেবে কাজ করছে। যেহেতু বিটকয়েনের মূল্য

Dimitrios Zappas 08:58 2025-07-23 UTC+2

স্বর্ণের (XAU/USD) ট্রেডিং সিগন্যাল, ২৩–২৬ জুলাই, ২০২৫: স্বর্ণের মূল্য $3,437 (21 SMA - 8/8 মারে)-এর নিচে থাকা অবস্থায় এটি বিক্রি করুন

তবে যদি স্বর্ণের মূল্য 3,437-এর ওপরে কনসোলিডেট করে, তাহলে স্বর্ণের মূল্যের বুলিশ প্রবণতার সম্ভাবনা তৈরি হবে। এ অবস্থায়, মূল্য প্রথমে +1/8 মারে (3,472)-তে পৌঁছাতে পারে এবং এমনকি $3,500-এর সাইকোলজিক্যাল রেজিস্ট্যান্স

Dimitrios Zappas 08:52 2025-07-23 UTC+2

স্বর্ণের (XAU/USD) ট্রেডিং সিগন্যাল, ২২-২৫ জুলাই, ২০২৫: স্বর্ণের মূল্য $3,380 এর উপরে থাকা অবস্থায় কিনুন এবং $3,370 এর (200 EMA - 7/8 মারে) নিচে থাকা অবস্থায় বিক্রি করুন

ঈগল ইন্ডিকেটর ওভারবট জোনে পৌঁছেছে, তাই আমরা মনে করি স্বর্ণের মূল্য আসন্ন দিনগুলোতে একটি শক্তিশালী টেকনিক্যাল কারেকশনের মধ্য দিয়ে যেতে পারে। বিশেষ করে যদি মূল্য 6/8 মাড়ে লেভেলের নিচে নেমে

Dimitrios Zappas 08:35 2025-07-22 UTC+2

বিটকয়েনের ট্রেডিং সিগন্যাল, ২২-২৫ জুলাই, ২০২৫: মূল্য $115,625-এর (/8 মারে - 21 SMA) এর উপরে থাকা অবস্থায় বিটকয়েন কিনুন

বিটকয়েন বর্তমানে প্রায় $117,522 এর আশেপাশে ট্রেড করছে, এটির মূল্য $116,070 এর নিচে থেকে পুনরুদ্ধার করেছে। গতকাল ইউরোপীয় সেশনে বিটকয়েনের মূল্য $119,500-এর উচ্চতায় পৌঁছেছিল, তবে $120,000 এর সাইকোলজিক্যাল লেভেলের উপরে

Dimitrios Zappas 08:19 2025-07-22 UTC+2

বিটকয়েনের ট্রেডিং সিগন্যাল, ১৮-২১ জুলাই, ২০২৫: মূল্য $118,000 (6/8 মারে - 21 SMA) এর উপরে থাকা অবস্থায় বিটকয়েন ক্রয় করুন

যদি 118,750-এর সাপোর্ট বা 118,200 এর কাছাকাছি সেকেন্ডারি আপট্রেন্ড চ্যানেলের দিকে বিটকয়েনের মূল্যের টেকনিক্যাল কারেকশন হয়, তাহলে এটিকে বিটকয়েন ক্রয়ের সুযোগ হিসেবে বিবেচনা করা হবে, যেখানে এটির মূল্যের $121,500-এর দিকে

Dimitrios Zappas 09:45 2025-07-18 UTC+2
এখন কথা বলতে পারবেন না?
আপনার প্রশ্ন জিজ্ঞাসা করুন চ্যাট.
Widget callback
 

Dear visitor,

Your IP address shows that you are currently located in the USA. If you are a resident of the United States, you are prohibited from using the services of InstaFintech Group including online trading, online transfers, deposit/withdrawal of funds, etc.

If you think you are seeing this message by mistake and your location is not the US, kindly proceed to the website. Otherwise, you must leave the website in order to comply with government restrictions.

Why does your IP address show your location as the USA?

  • - you are using a VPN provided by a hosting company based in the United States;
  • - your IP does not have proper WHOIS records;
  • - an error occurred in the WHOIS geolocation database.

Please confirm whether you are a US resident or not by clicking the relevant button below. If you choose the wrong option, being a US resident, you will not be able to open an account with InstaForex anyway.

We are sorry for any inconvenience caused by this message.